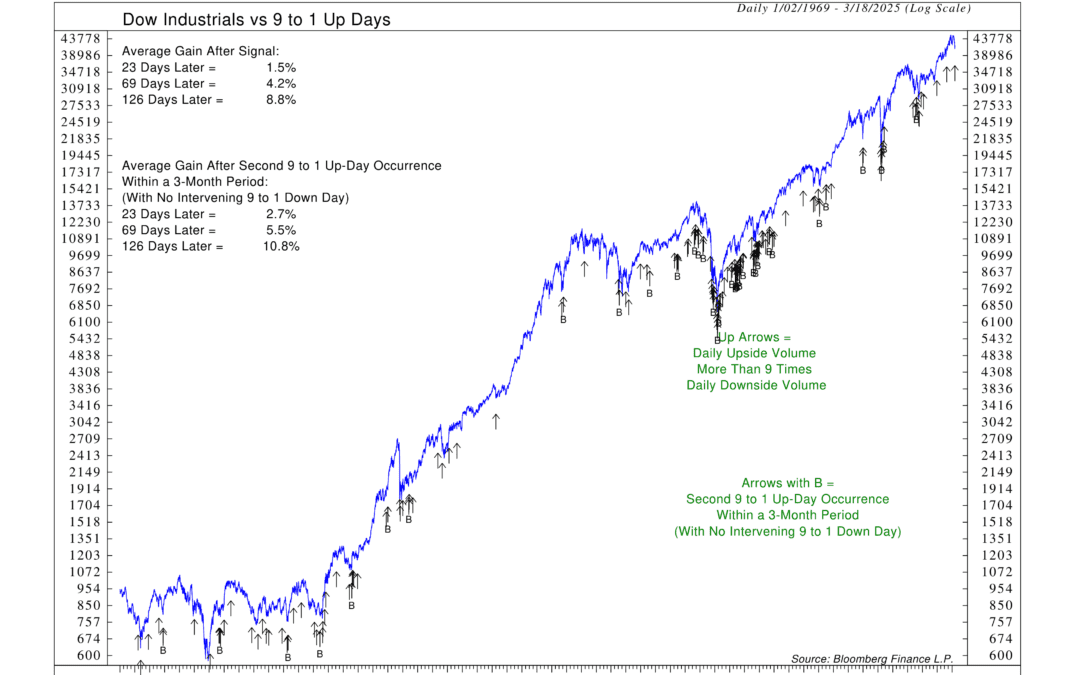
The Power of Two
When the stock market is down, we have a few tools in our toolkit that we use to gauge when the selling might be over. This week’s indicator, measuring 9-to-1 Up Days, is one of them. It produces a somewhat rare but historically important signal that tends to...Financial Focus – March 19th, 2025
With tax season flying by, Nate Kreinbrink and Andy Fergurson remind listeners to double-check their paycheck withholdings before it’s too late. They also share tips on missing tax documents and how smart income planning can help you avoid surprises next April.
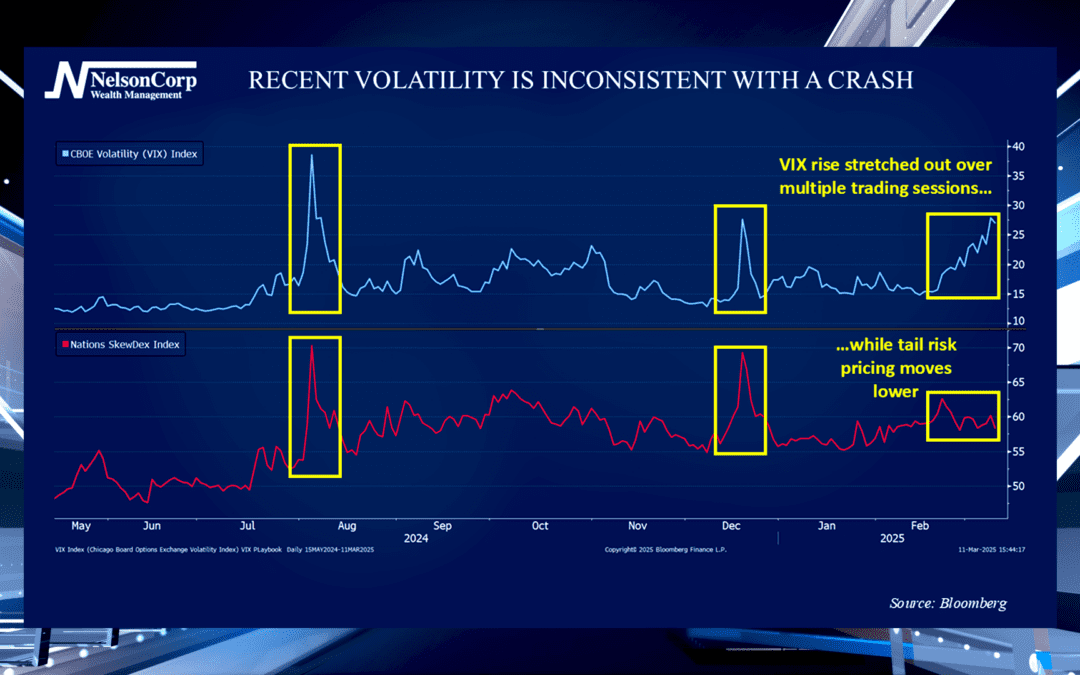
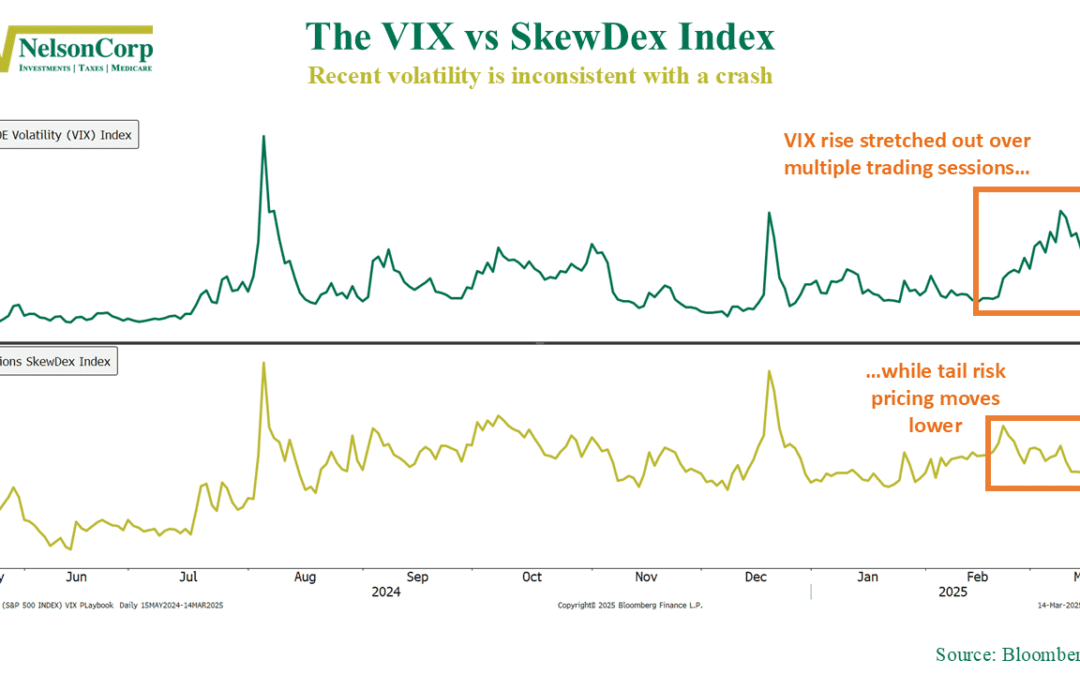
Volatility Watch
Market volatility has been rising and investors are rightfully concerned. David Nelson joins us to share two indexes Wall Street uses to gauge fear in the market and advises viewers to be cautious moving forward.
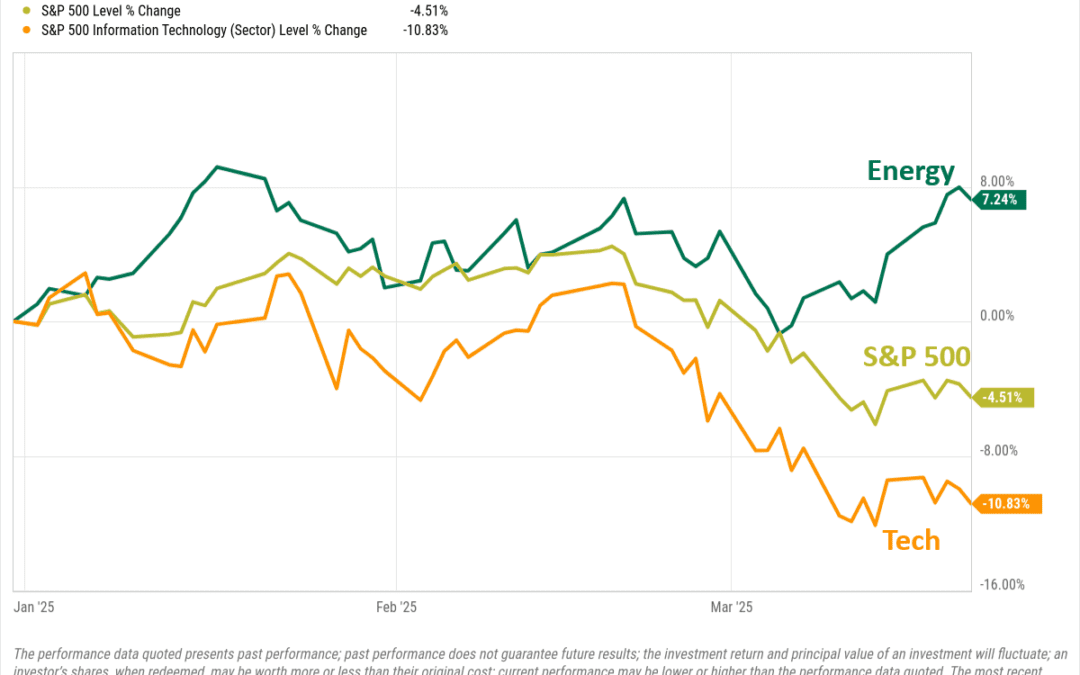
Correction in Context
The market slipped into correction territory last week. Was this a stumble or the start of a slide? Check out this week’s commentary to see why stocks and credit markets and seeing things differently—and what it all means for investors.