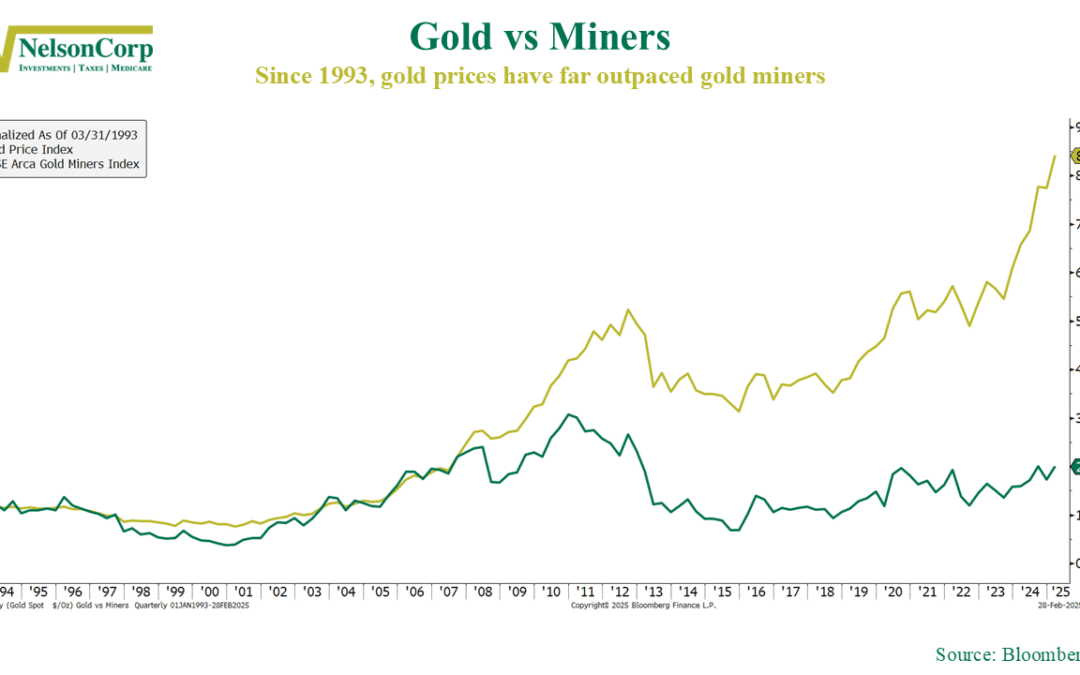

Strength Is Relative
Everything is relative. Sure, you’ve probably heard that before. But it holds true in the stock market, too. Relative strength isn’t about measuring something in isolation. It’s about how it performs compared to something else—a benchmark. Think of it like...Financial Focus – February 26th, 2025
This week’s Financial Focus, hosted by Nate Kreinbrink and Mike VanZuiden, covers the complexities of Medicare enrollment and the importance of reviewing options regularly. They emphasize understanding enrollment periods, making informed decisions, and seeking professional guidance to navigate Medicare effectively.
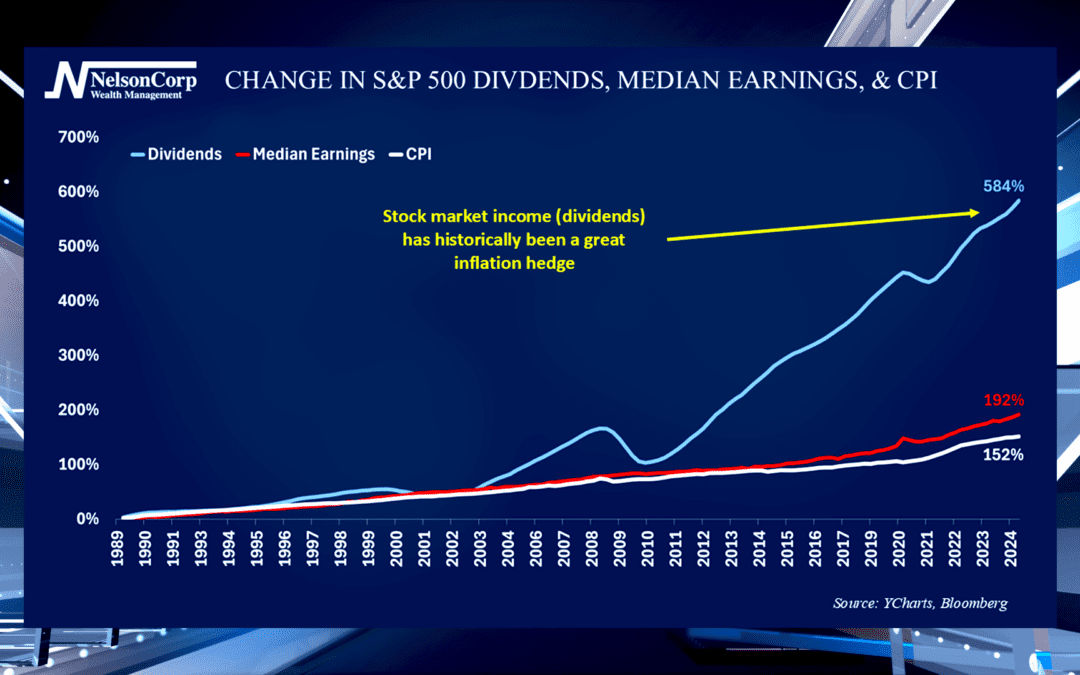
Inflation Hedge
With inflation still a major concern, investors want to know how to protect their purchasing power. David Nelson joins us to explain why investors should not ignore their assets income potential.
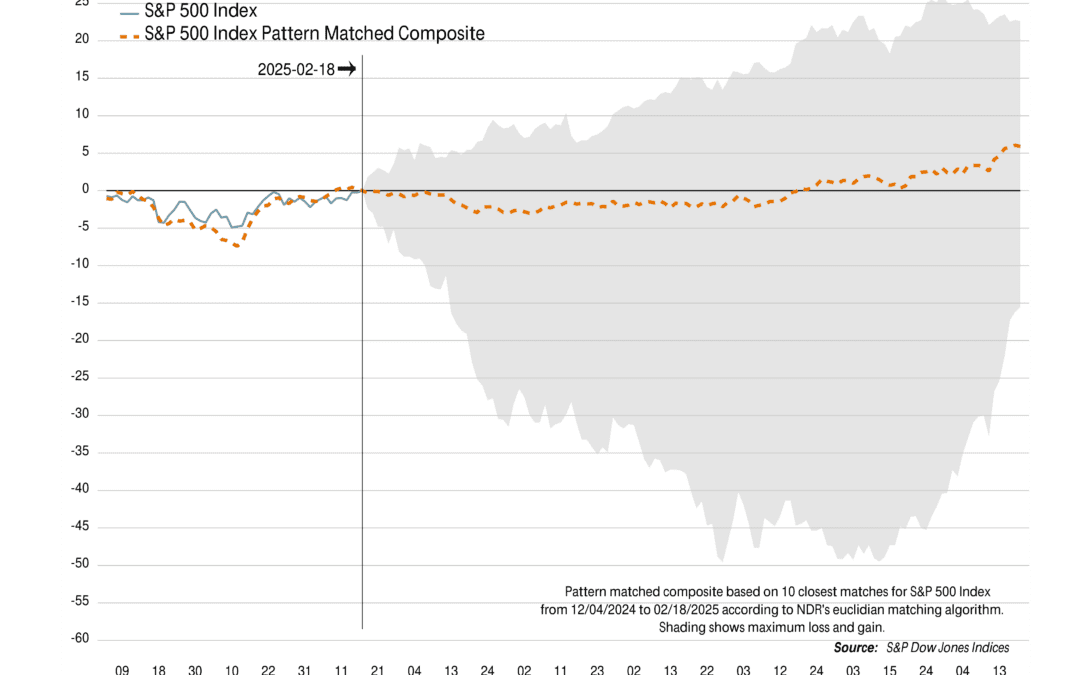
Cracking the Consolidation Code
The market has been treading water, but the pressure is building for a big move. Will it be a breakout or a breakdown? History offers some clues—check out this week’s commentary to see what could be coming next!