
by NelsonCorp Wealth Management | Jul 7, 2023 | Chart of the Week
This week’s featured chart shows that the percentage of companies in the U.S. stock market-beating earnings expectations increased significantly in the first quarter of the year, breaking a prolonged downturn that started near the end of 2021. As the middle...
by NelsonCorp Wealth Management | Jun 30, 2023 | Chart of the Week
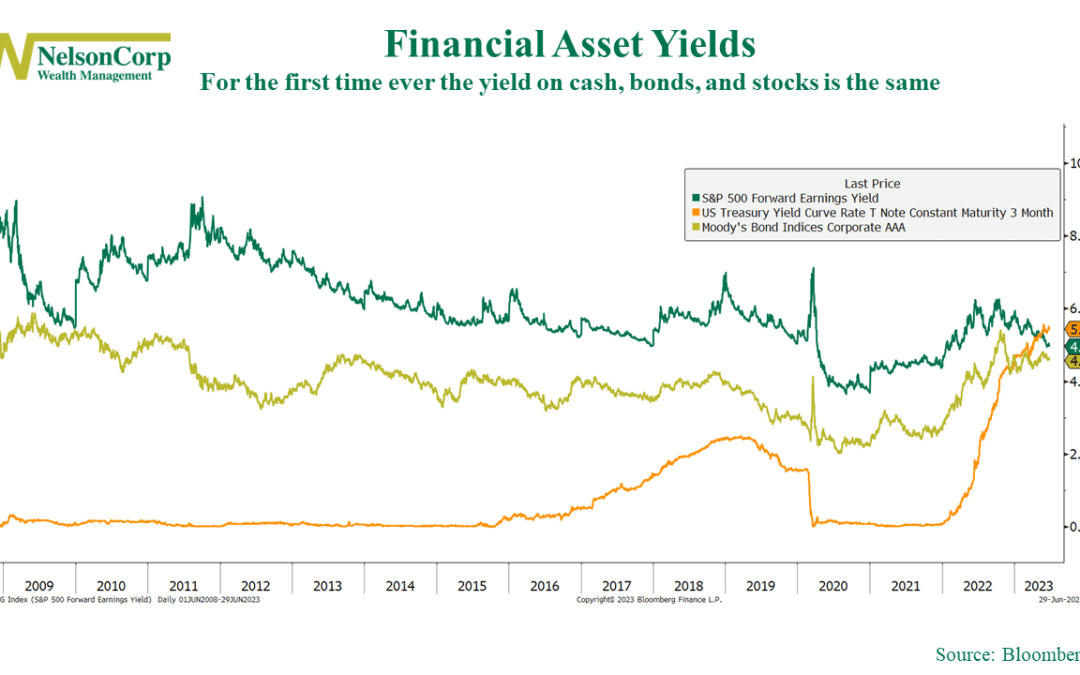
This week’s chart features the yields of the three primary financial assets investors focus on: cash, bonds, and stocks. The green line represents the forward earnings yield for the S&P 500 (stocks), the gold line represents the yield on investment-grade...
by NelsonCorp Wealth Management | Jun 23, 2023 | Chart of the Week
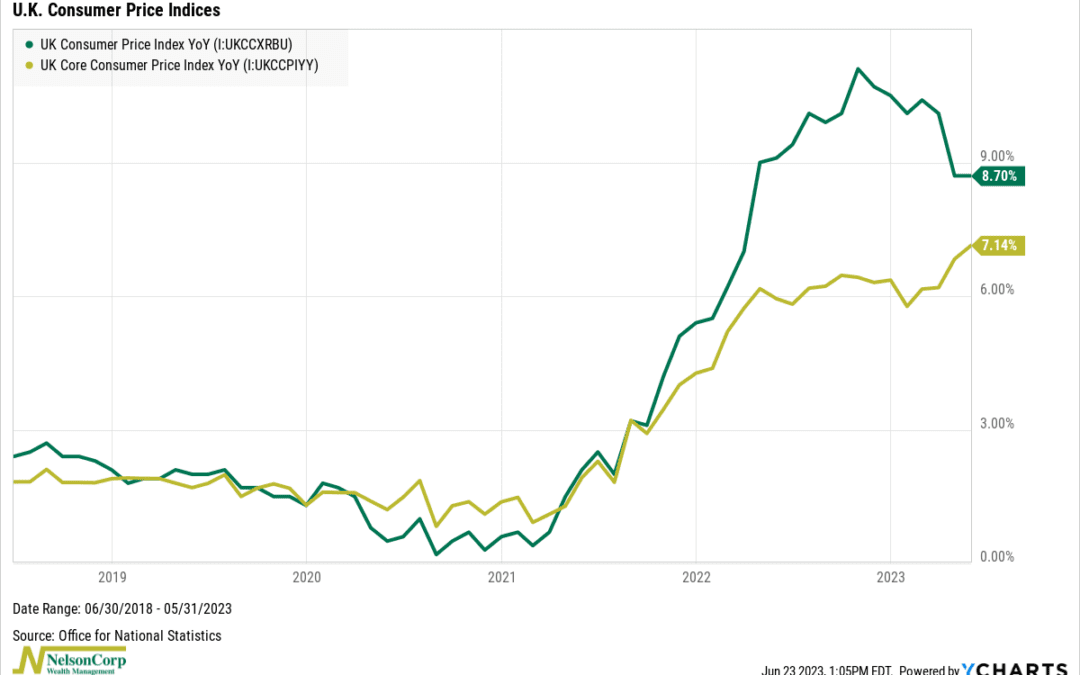
We’ve discussed how inflation seems to be moving in the right direction here in the U.S. But across the pond, things look more worrisome. The U.K. has the worst inflation problem of any major developed county, and last month, it got worse. As our featured chart...
by NelsonCorp Wealth Management | Jun 16, 2023 | Chart of the Week
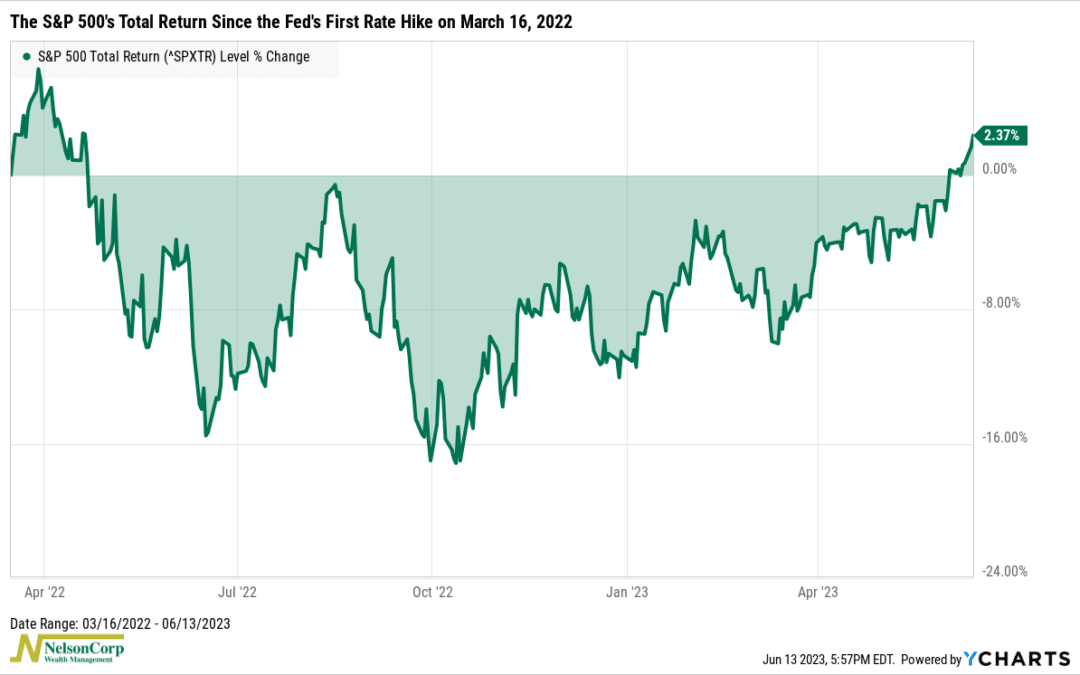
The stock market has been on quite the roller coaster ride since the Fed first started hiking rates last year to fight inflation. But, as our featured chart this week shows, the S&P 500 is finally back in the black for the first time since it originally...
by NelsonCorp Wealth Management | Jun 9, 2023 | Chart of the Week
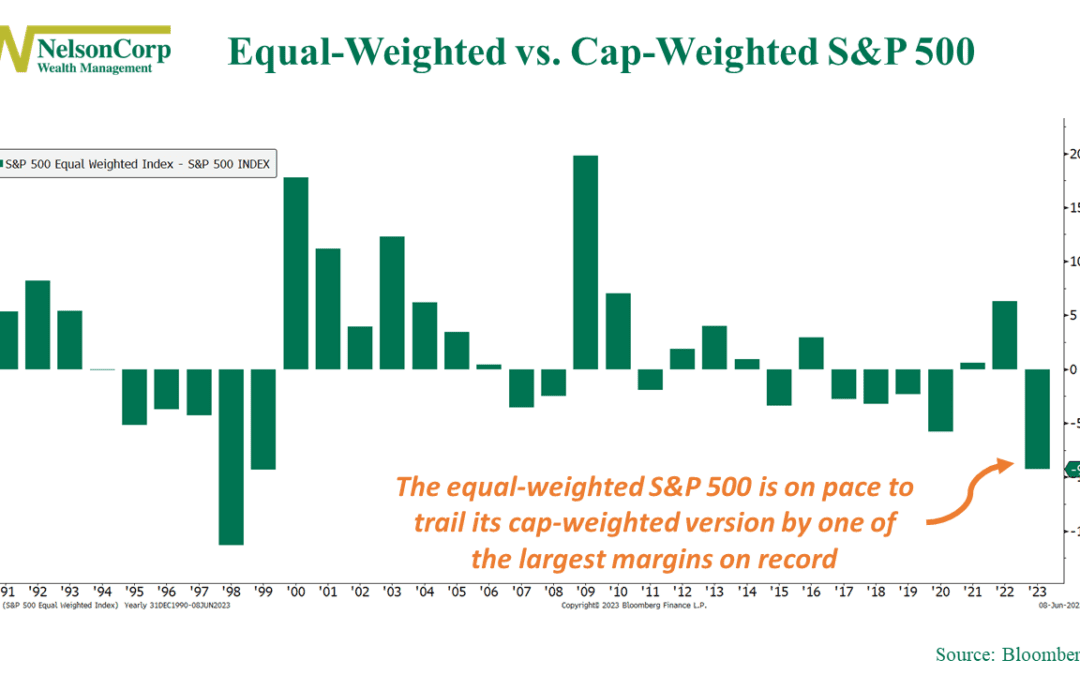
We find ourselves in yet another tale of two markets this year. The tech-heavy Nasdaq is up nearly 30% year-to-date, whereas the blue-chip-heavy Dow was flat through May—the widest spread in nearly 40 years. Another way to view how narrow this market rally has...
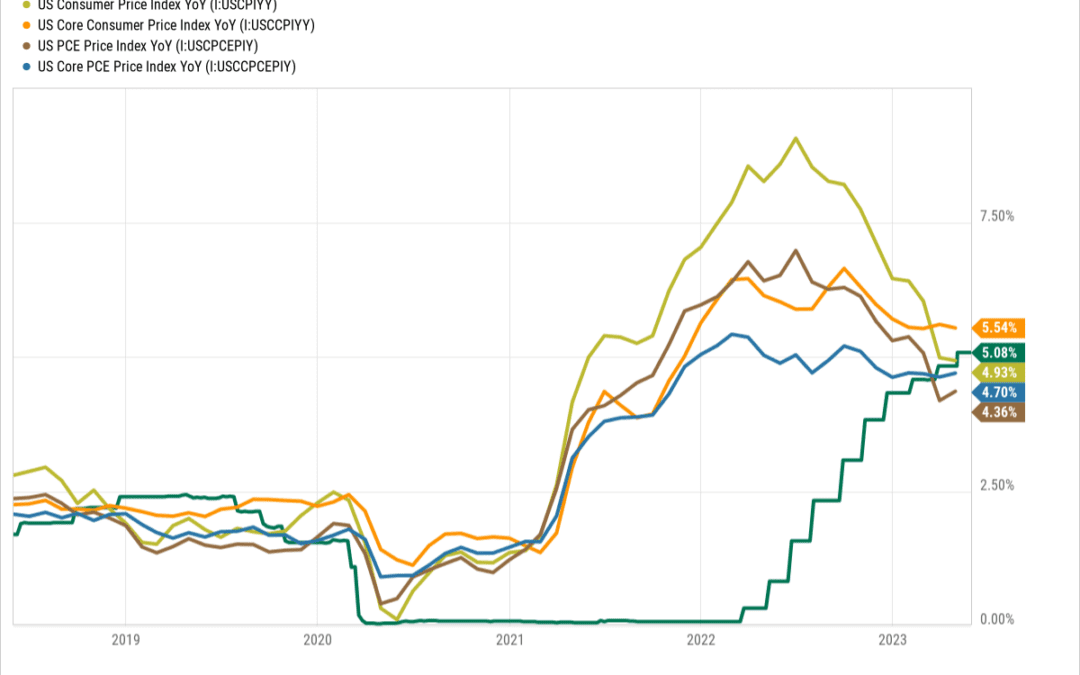
by NelsonCorp Wealth Management | Jun 2, 2023 | Chart of the Week
Inflation has been a thorn in the side of investors for a while now. But the good news is that we recently hit a major milestone in the fight against inflation. As our featured chart of the week above shows, the fed funds rate—the rate controlled by the Federal...