by NelsonCorp | Oct 31, 2025 | Chart of the Week
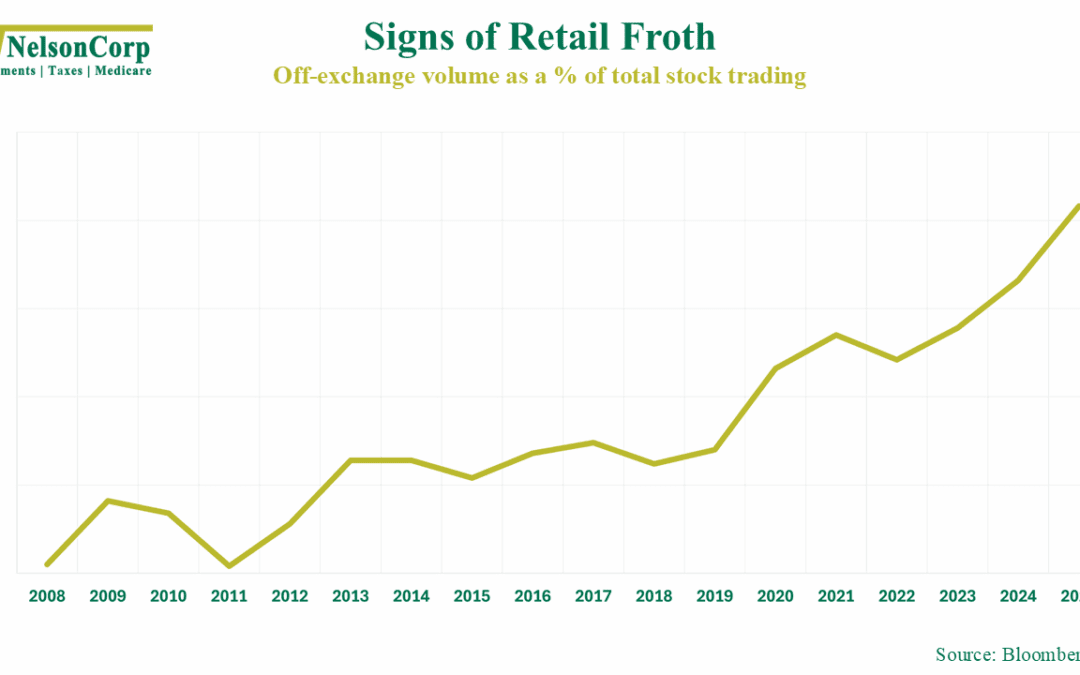
The stock market is starting to look a lot like the top of my wife’s double-shot espresso latte: frothy. Frothy, in the context of the stock market, means prices are being driven more and more by excitement and speculation than by fundamentals. For example,...
by NelsonCorp | Oct 24, 2025 | Chart of the Week
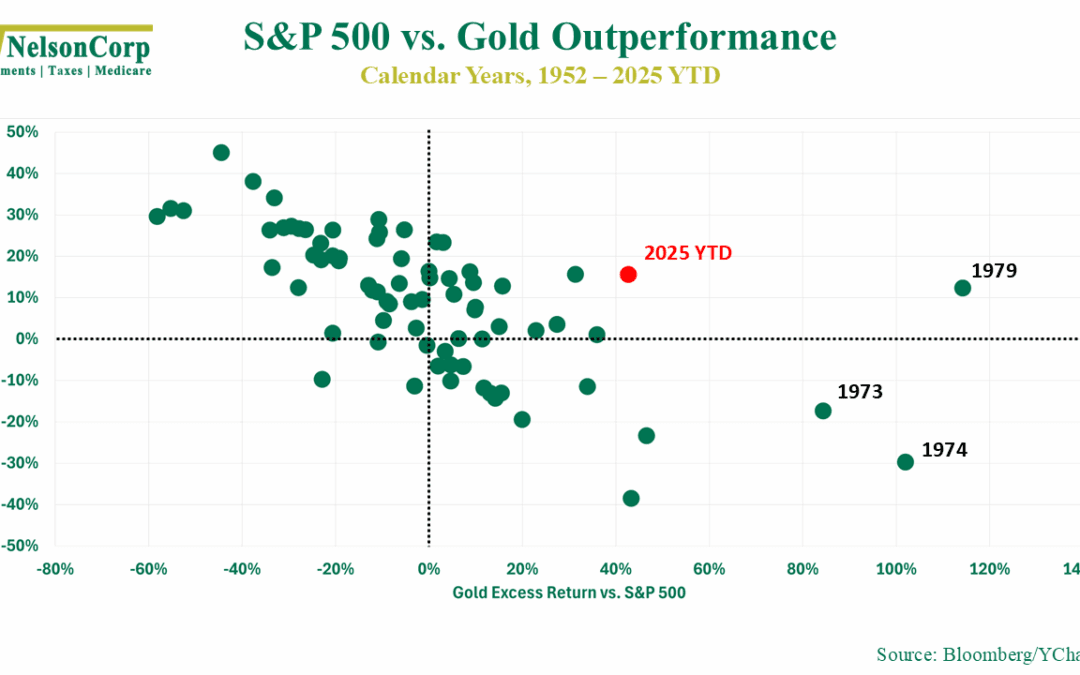
This week’s chart takes a look at the relationship between stocks and gold, a classic rivalry between growth and safety. Each dot on the chart represents a calendar year from 1952 through 2025, plotting the S&P 500’s annual price return (vertical axis)...
by NelsonCorp | Oct 17, 2025 | Chart of the Week
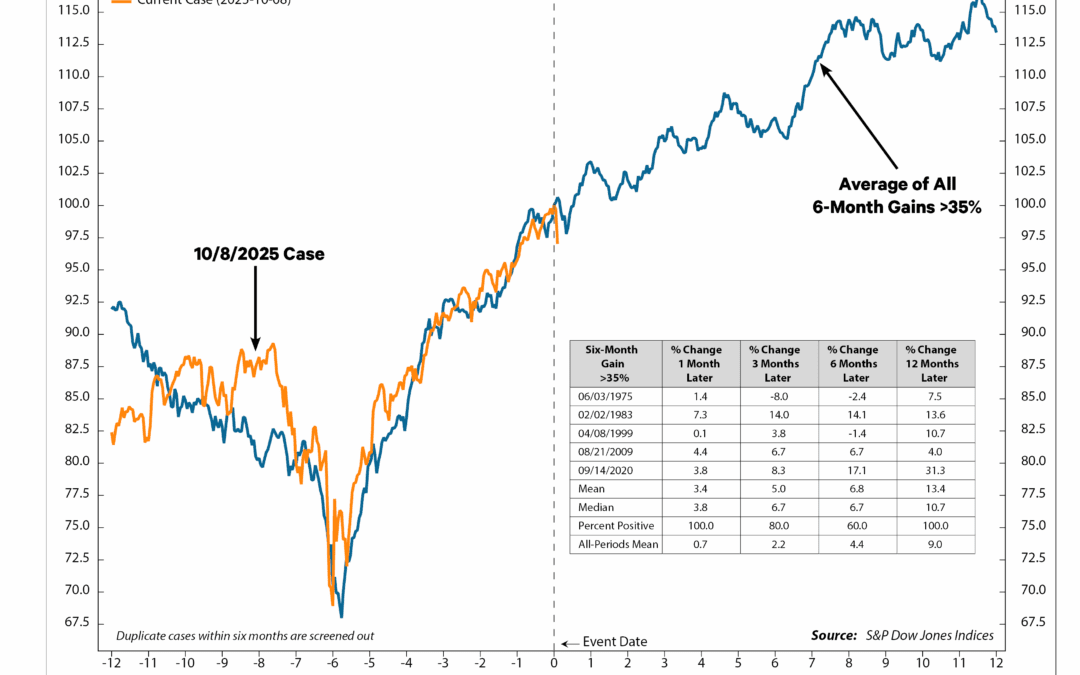
I’ve got an interesting chart for folks this week. It shows how the stock market (S&P 500 Index) has historically performed, on average, after a 6-month rally of at least 35%. That’s the blue line—the average. Why is that interesting? Because the orange...
by NelsonCorp | Oct 10, 2025 | Chart of the Week
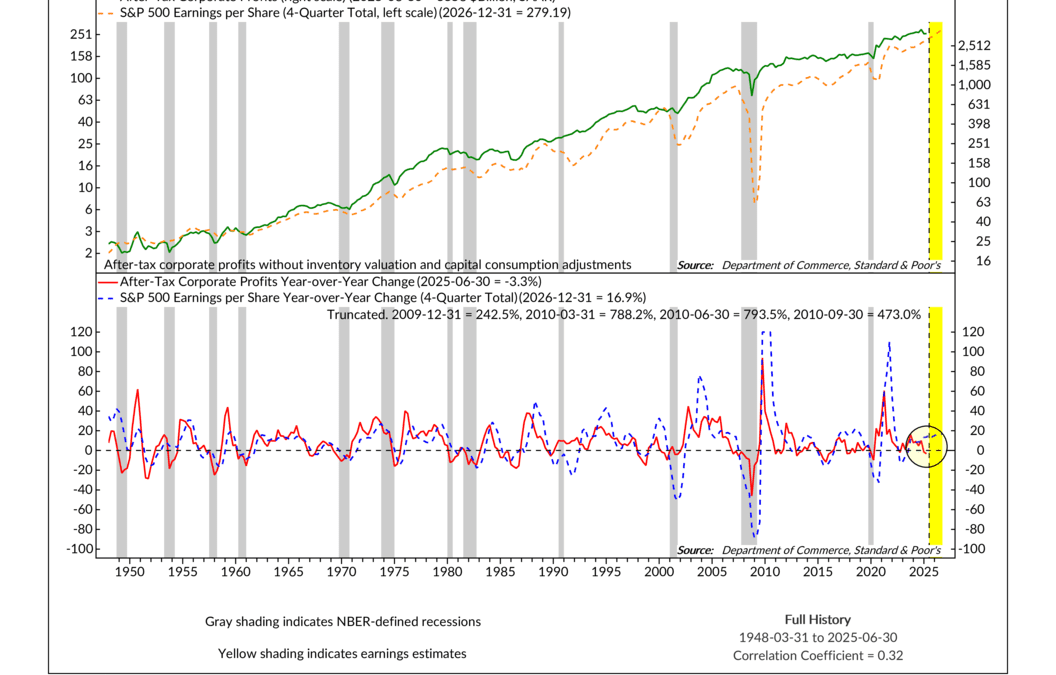
This week’s chart compares S&P 500 reported earnings (orange line, top panel) with after-tax corporate profits from the National Income and Product Accounts, or NIPA (green line, top panel). NIPA profits track economy-wide corporate earnings,...
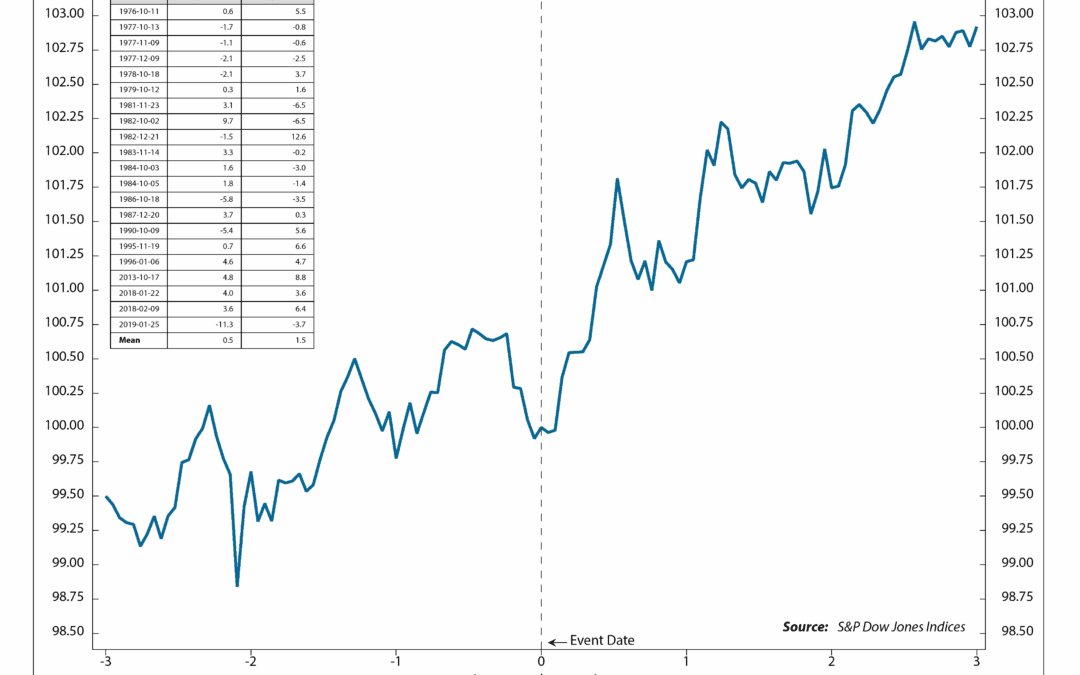
by NelsonCorp | Oct 3, 2025 | Chart of the Week
Well, it happened again. The U.S. government went into “shutdown” this week after Congress couldn’t agree on a stopgap funding bill. We’ve seen this before, and while it makes for plenty of high drama in Washington, for the stock market it tends to be more of a...
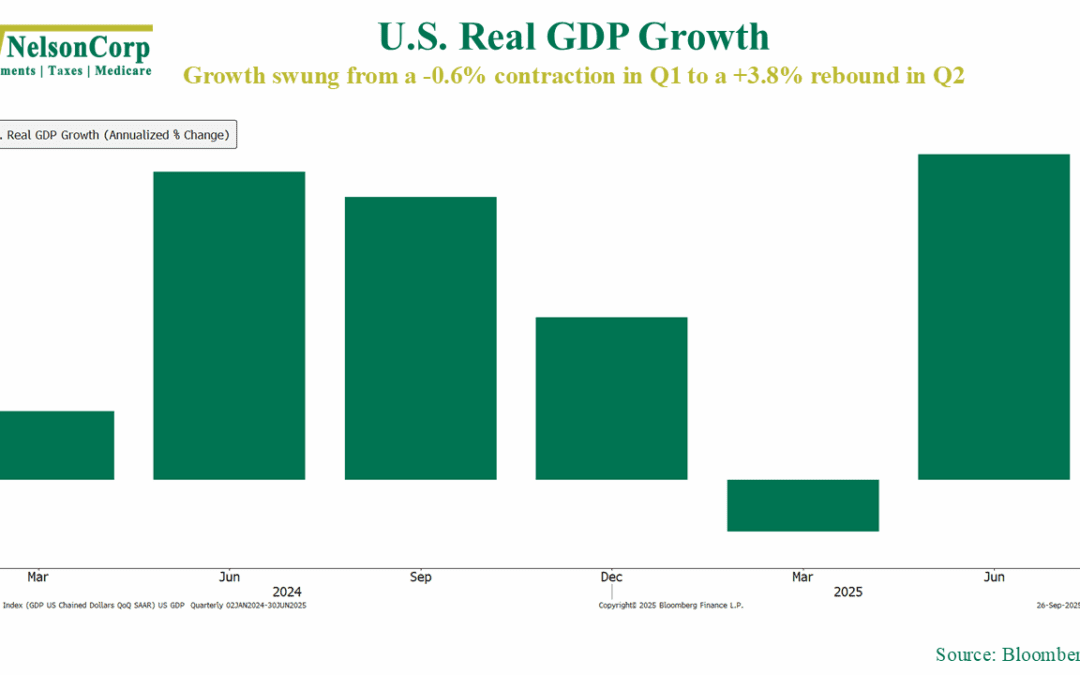
by NelsonCorp | Sep 29, 2025 | Chart of the Week
The U.S. economy is looking pretty strong again—or at least it was last quarter. Real GDP growth was revised in the second quarter to 3.8%, a sharp rebound from the -0.6% decline in the previous quarter. As a reminder, real GDP is a measure of...