
Big Bounce
Stocks have come roaring back since April, and this week’s chart shows why it’s catching attention. Among past corrections, this rebound is the fastest and strongest by far.
Stocks have come roaring back since April, and this week’s chart shows why it’s catching attention. Among past corrections, this rebound is the fastest and strongest by far.
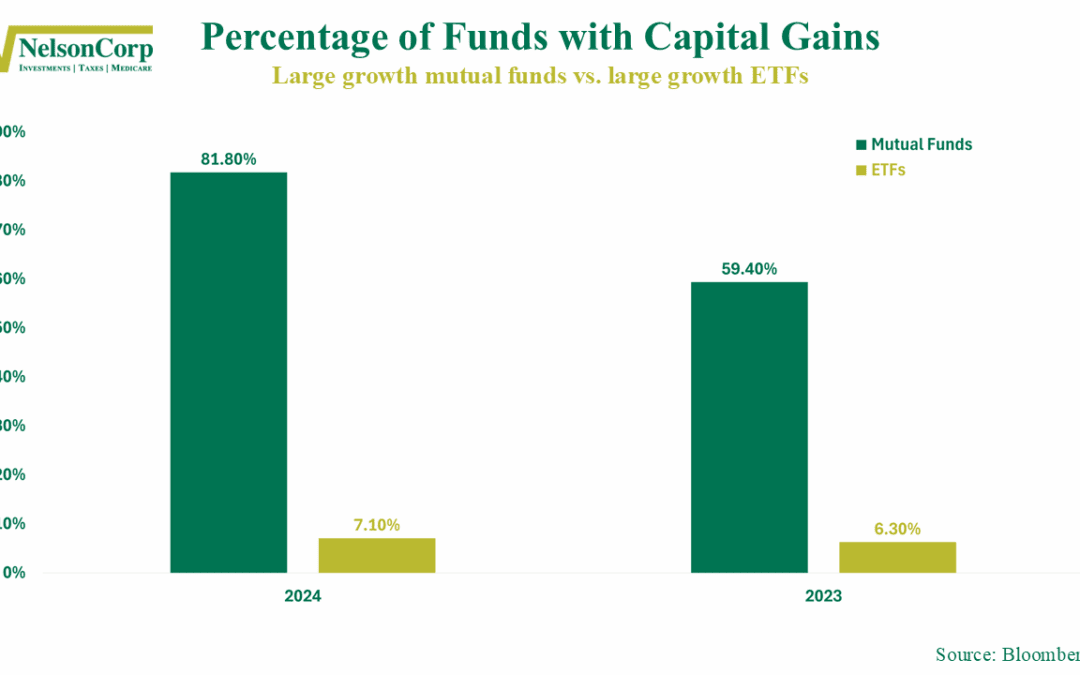
Think all funds are taxed the same? This week’s chart shows why ETFs are often the smarter choice for tax-sensitive investors—and how that gap has grown even wider in 2024.
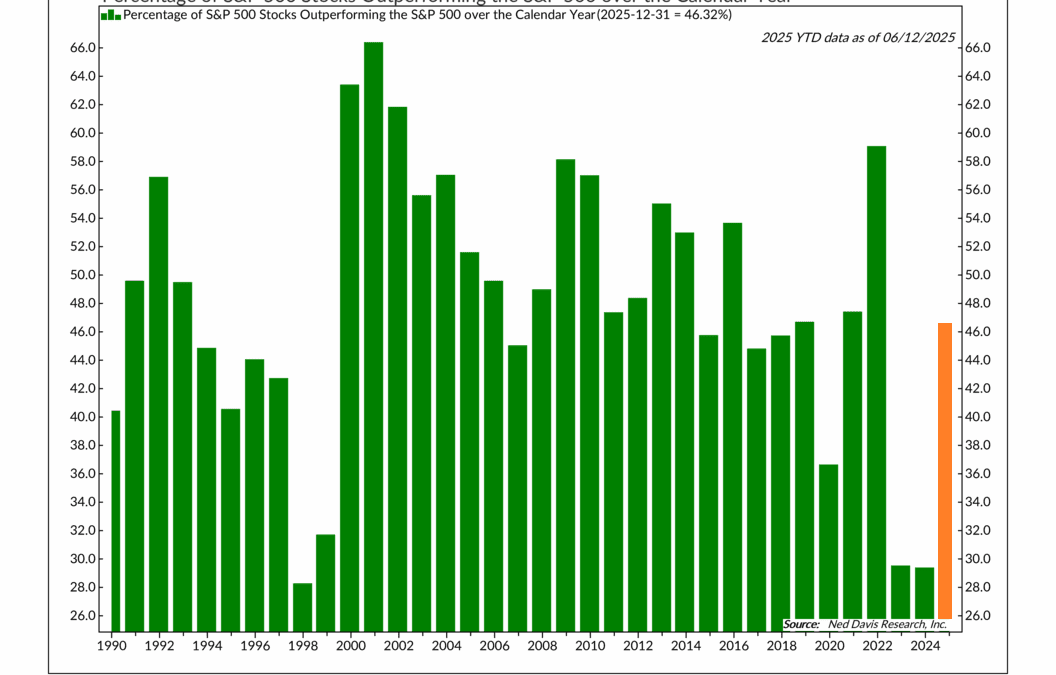
This week’s chart shows that more stocks are pulling their weight in 2025. After two years of gains driven by just a handful of tech giants, nearly half of the S&P 500 is now beating the index—bringing the market back to a more balanced and healthier place.
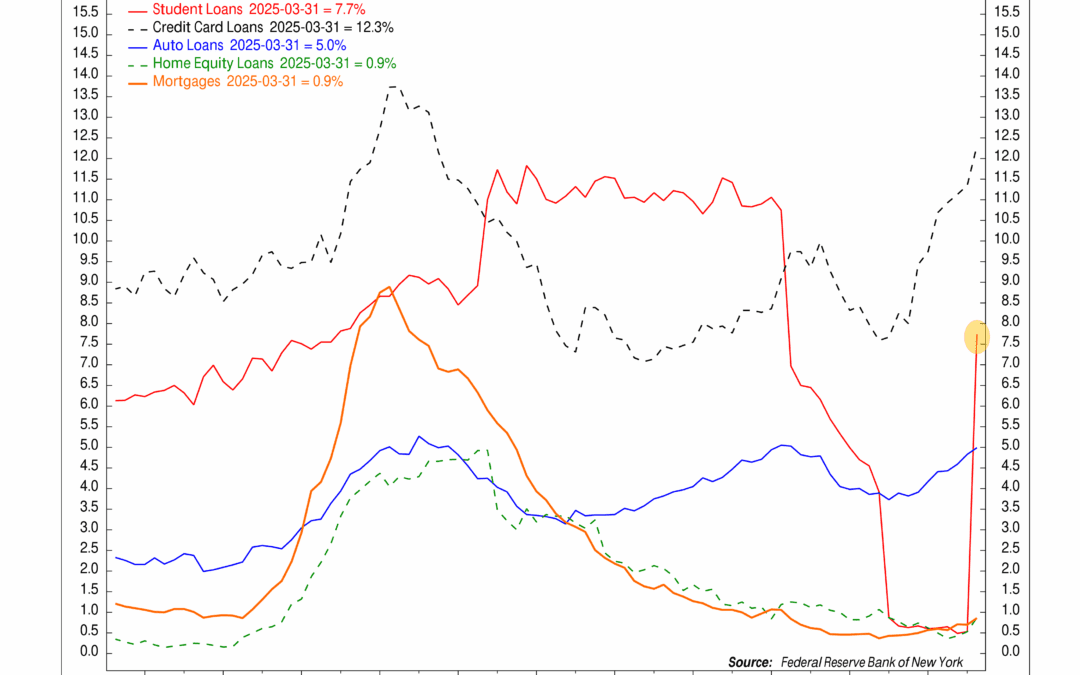
Americans are falling behind on student loans at the fastest pace in years. With savings shrinking and debt piling up, the financial strain is starting to show.

Interest rates are rising—and so are the headlines. But while the U.S. 10-year Treasury yield has been labeled everything from a warning sign to a market menace, the reality might be far less dramatic. This week’s chart puts the move in context, showing that today’s yields aren’t unusually high—they’re just not unusually low anymore.

Moody’s just hit the U.S. with a downgrade—should you be worried? History says the real story might be what happens after the headlines fade.