by NelsonCorp Wealth Management | Dec 26, 2024 | Indicator Insights
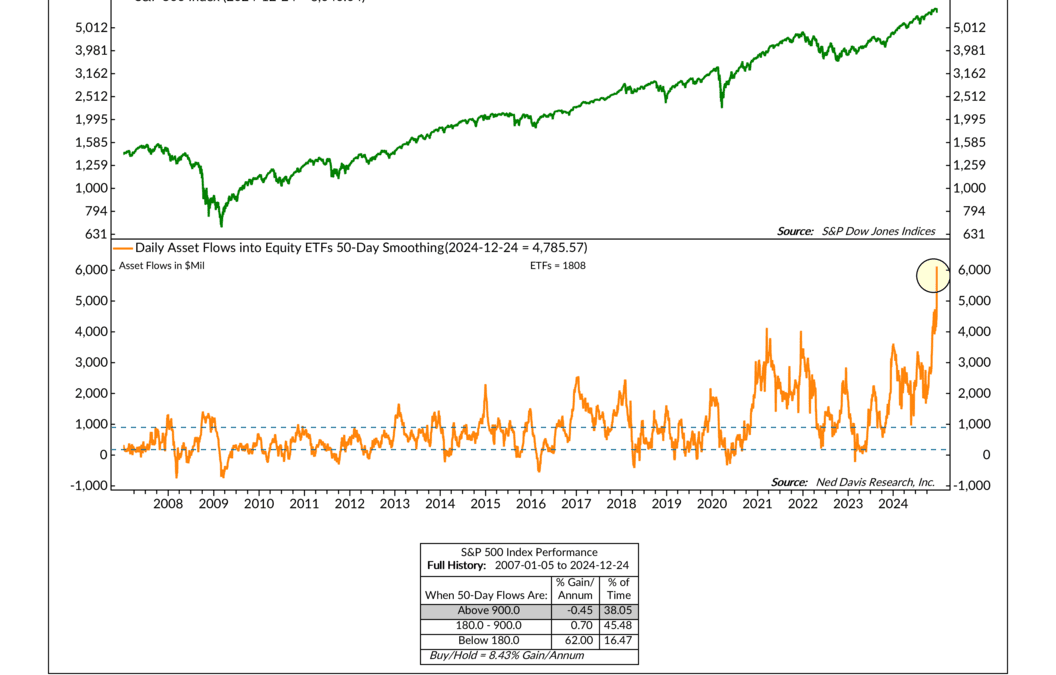
In this week’s indicator, we’re taking a closer look at equity ETF flows—and the story they’re telling is hard to ignore. The chart above tracks the 50-day average of daily inflows into U.S. stock funds. This metric smooths out day-to-day noise and gives us a...
by NelsonCorp Wealth Management | Dec 19, 2024 | Indicator Insights
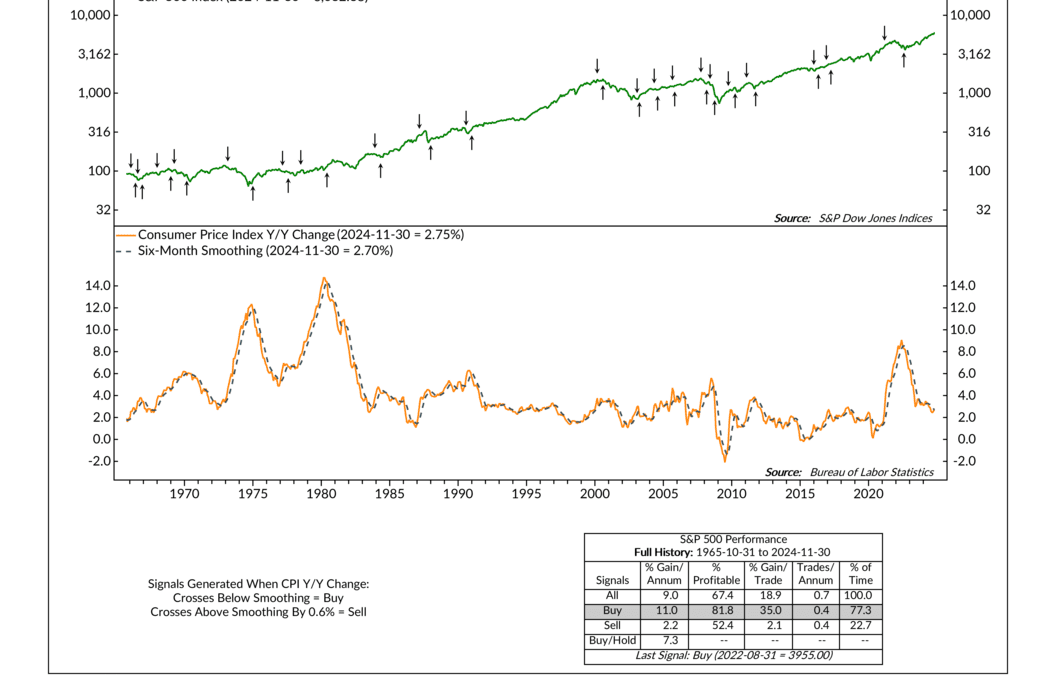
Inflation took center stage again this week as the Federal Reserve cut interest rates for the third time—exactly as expected. The real surprise, however, came with their announcement that they foresee fewer rate cuts next year than they predicted three months...
by NelsonCorp Wealth Management | Dec 12, 2024 | Indicator Insights
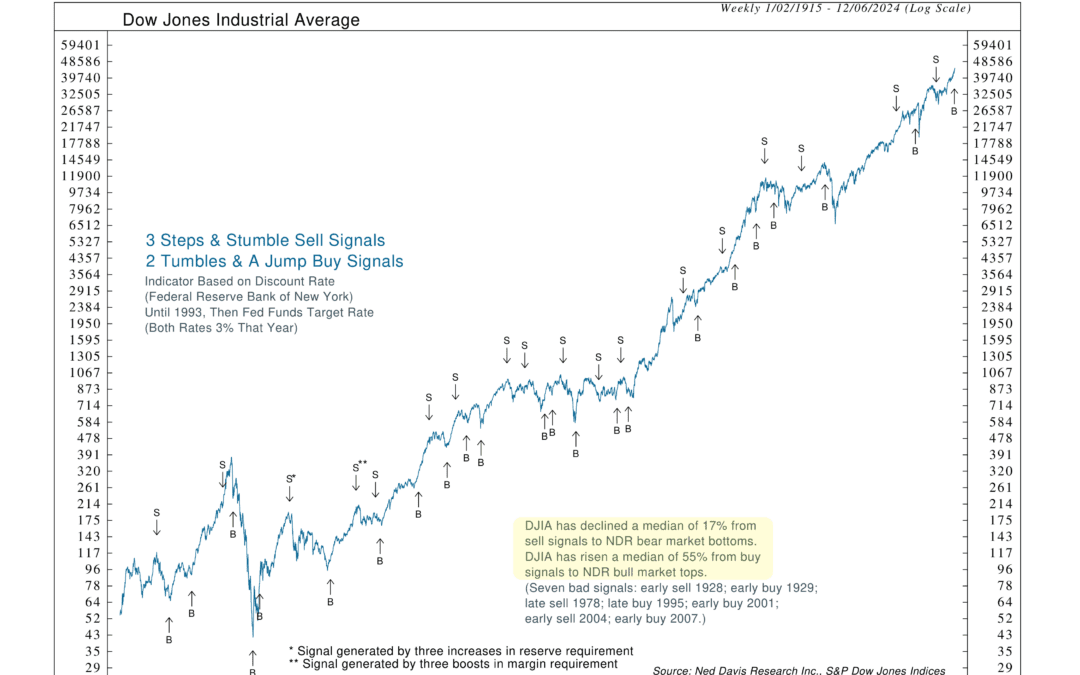
The Federal Reserve has a way of setting the tone for markets. Whether it’s tightening the screws with rate hikes or loosening the reins with cuts, its moves send ripples across Wall Street. So, for this week’s indicator, I want to highlight a metric that taps...
by NelsonCorp Wealth Management | Dec 5, 2024 | Indicator Insights
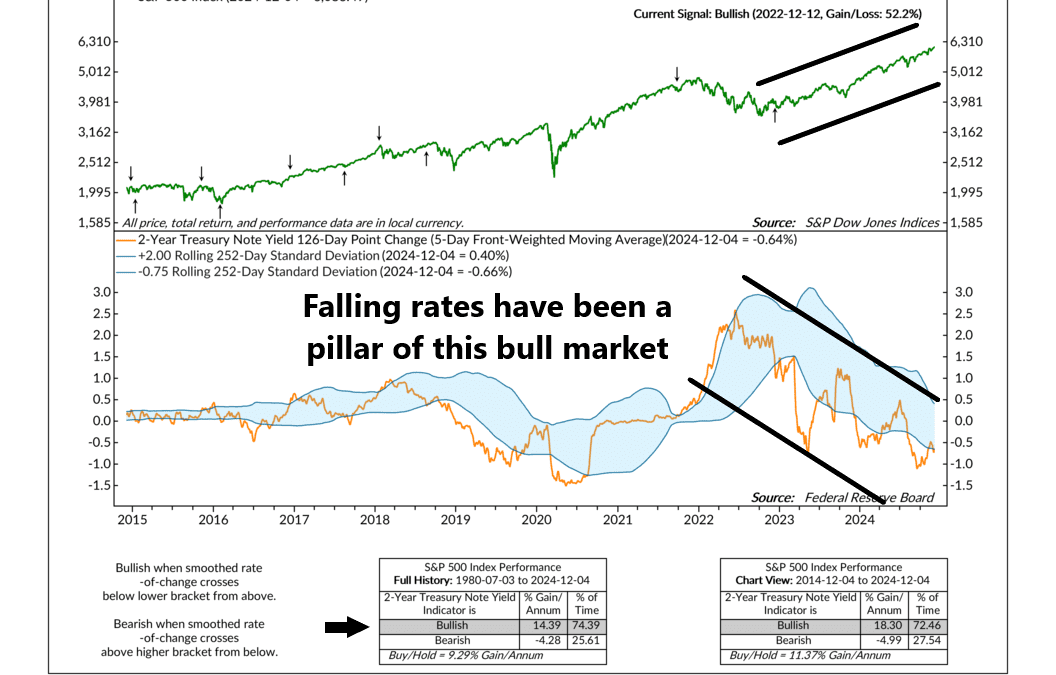
This week’s indicator is the cornerstone of the current bull market in stocks. But first, I’ll explain what it does. In essence, the indicator monitors shifts in interest rates to signal stock market trends. Specifically, it focuses on changes in the yield of...
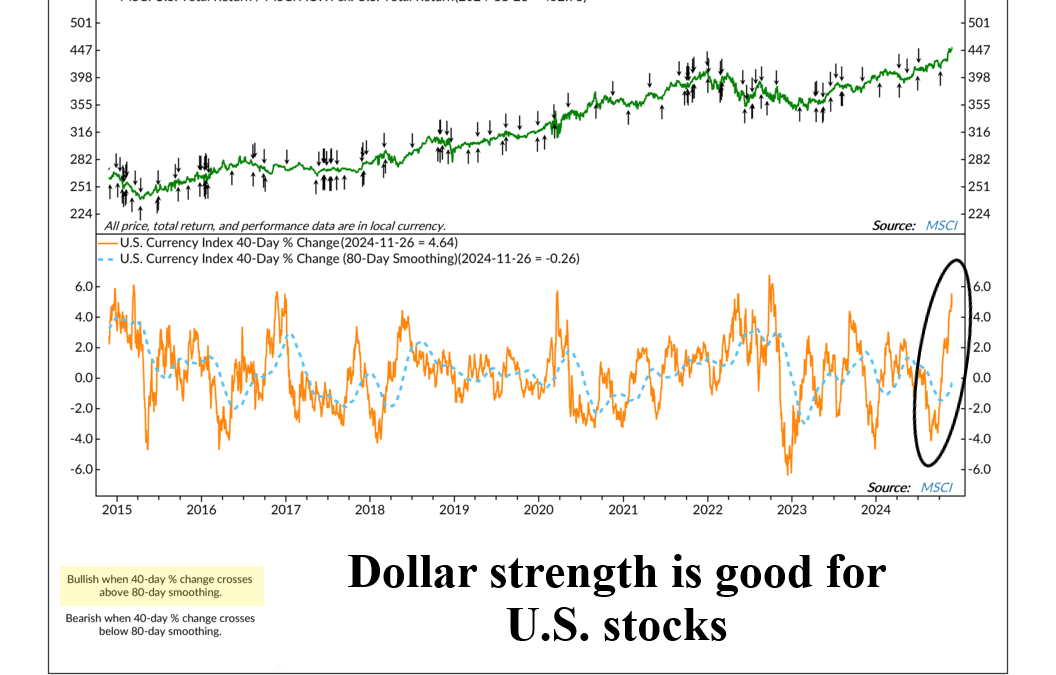
by NelsonCorp Wealth Management | Nov 28, 2024 | Indicator Insights
The U.S. dollar has been in the news a lot lately. If you haven’t noticed, the greenback has been flexing its strength against other major currencies. So, this is a great time to introduce this week’s indicator: the MSCI U.S. Relative Strength vs. U.S. Currency...
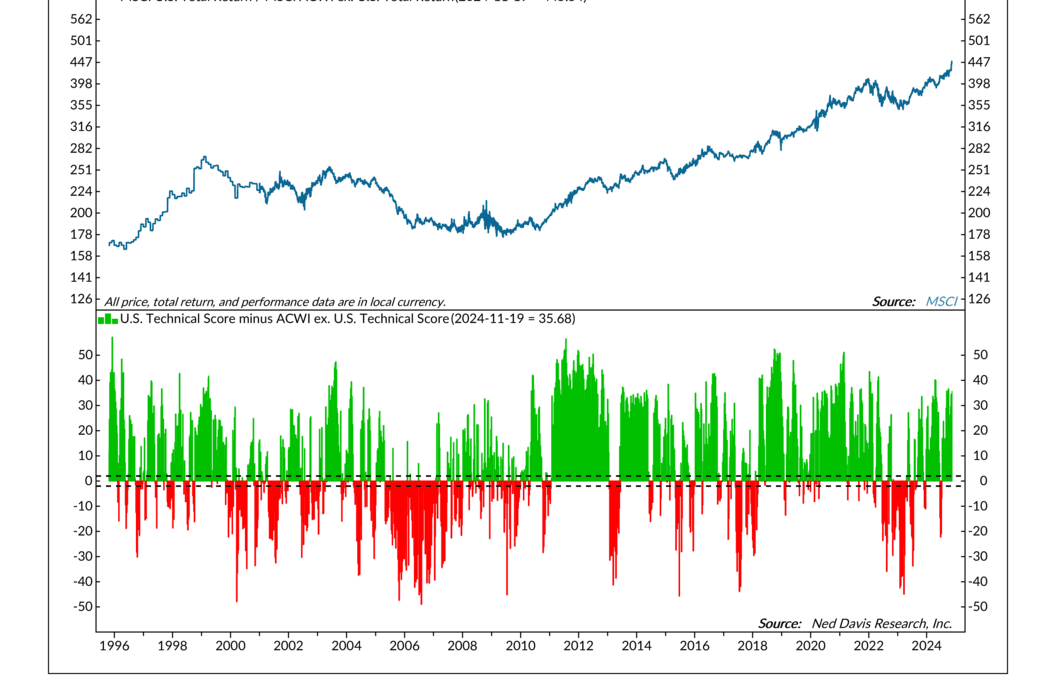
by NelsonCorp Wealth Management | Nov 22, 2024 | Indicator Insights
This week’s indicator is like a scoreboard showing how U.S. stocks are performing compared to the rest of the world. It’s based on something called the Technical Score Spread. How does it work? Imagine a global competition where each country’s stock market...