by NelsonCorp Wealth Management | Jun 20, 2024 | Indicator Insights
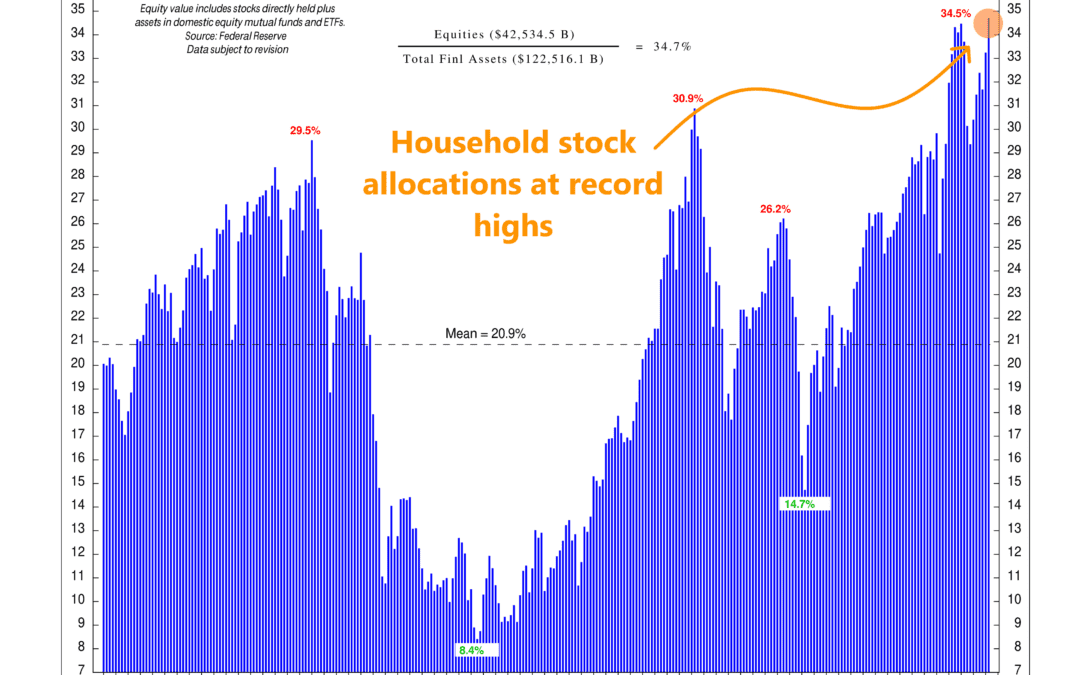
“I’m all in!” According to this week’s featured indicator, that’s what investors have been saying about the stock market recently. Specifically, the indicator above measures stocks as a percentage of household financial assets, revealing how much households are...
by NelsonCorp Wealth Management | Jun 13, 2024 | Indicator Insights
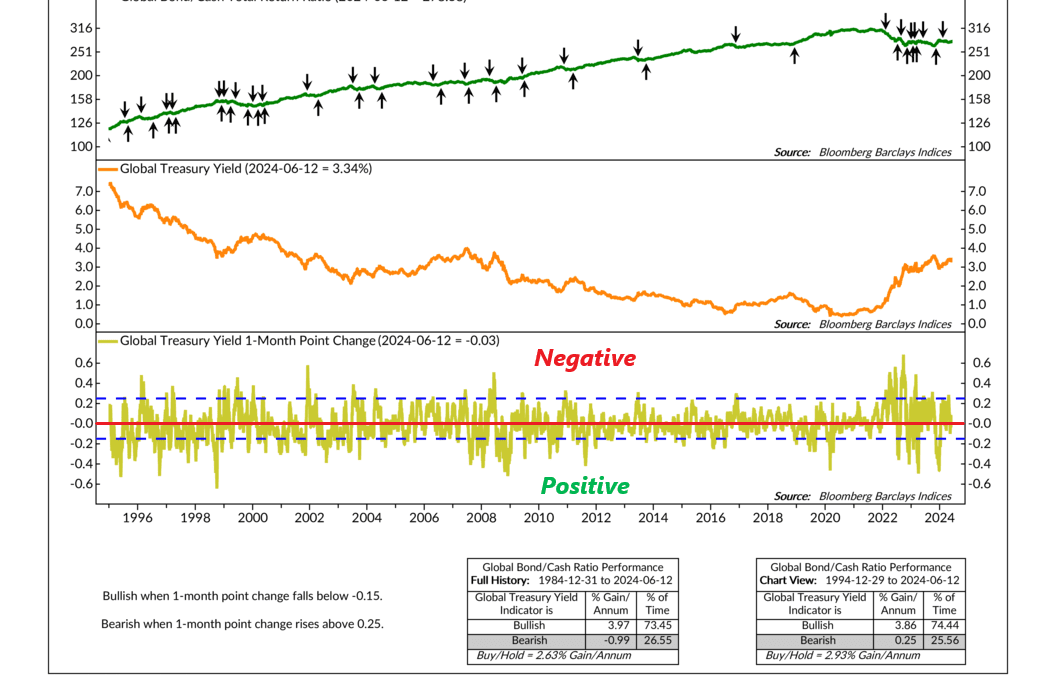
This week’s featured indicator is kind of like a wrench. When you turn a wrench, it creates a force called torque that helps move an object. But in this case, global treasury yields are the wrench, and the object being moved is the global bond/cash ratio. Let...
by NelsonCorp Wealth Management | Jun 6, 2024 | Indicator Insights
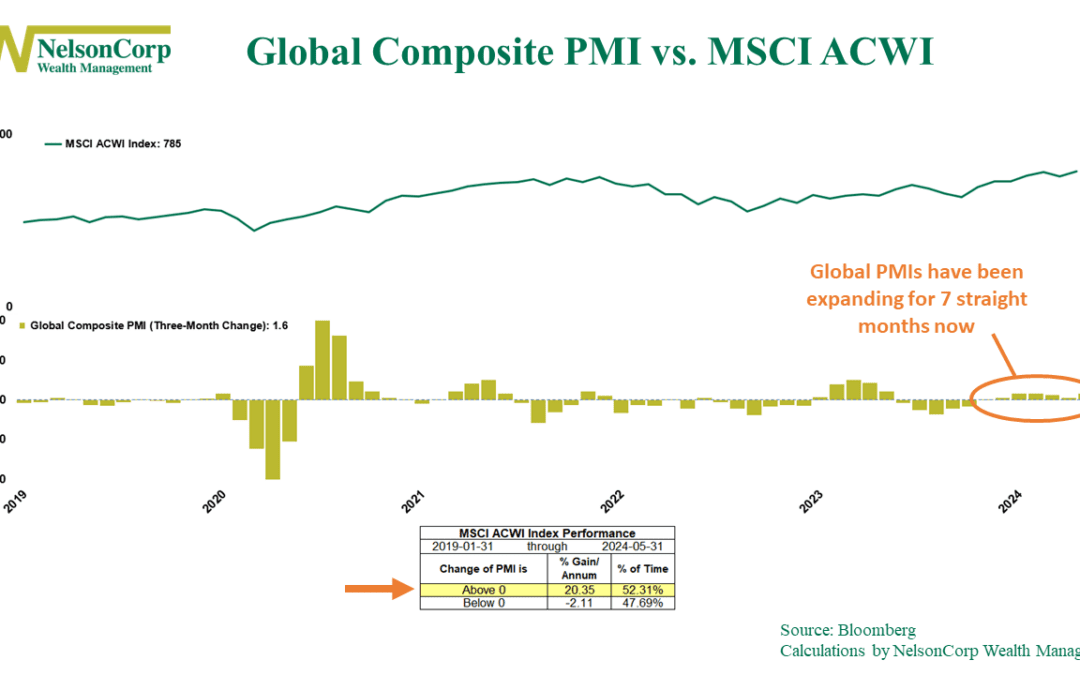
The global economy is still running strong. That’s the message from our two indicators on display this week. The first indicator, shown above, compares global stock market performance (top clip) to the 3-month change in the Global Composite PMI (bottom clip)....
by NelsonCorp Wealth Management | May 30, 2024 | Indicator Insights
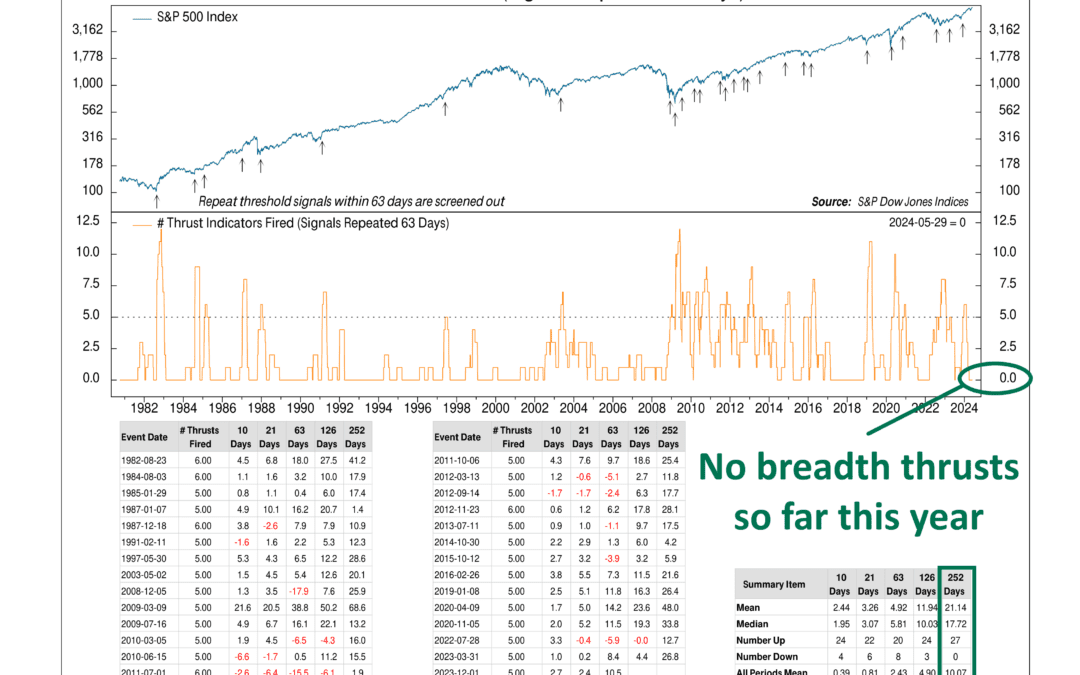
When a bunch of stocks skyrocket at the same time, in a strong and sudden fashion, we call it a breadth thrust. It’s a good thing for the overall stock market, as it’s a sign of a healthy and robust environment. Typically, when the market is in the beginning...
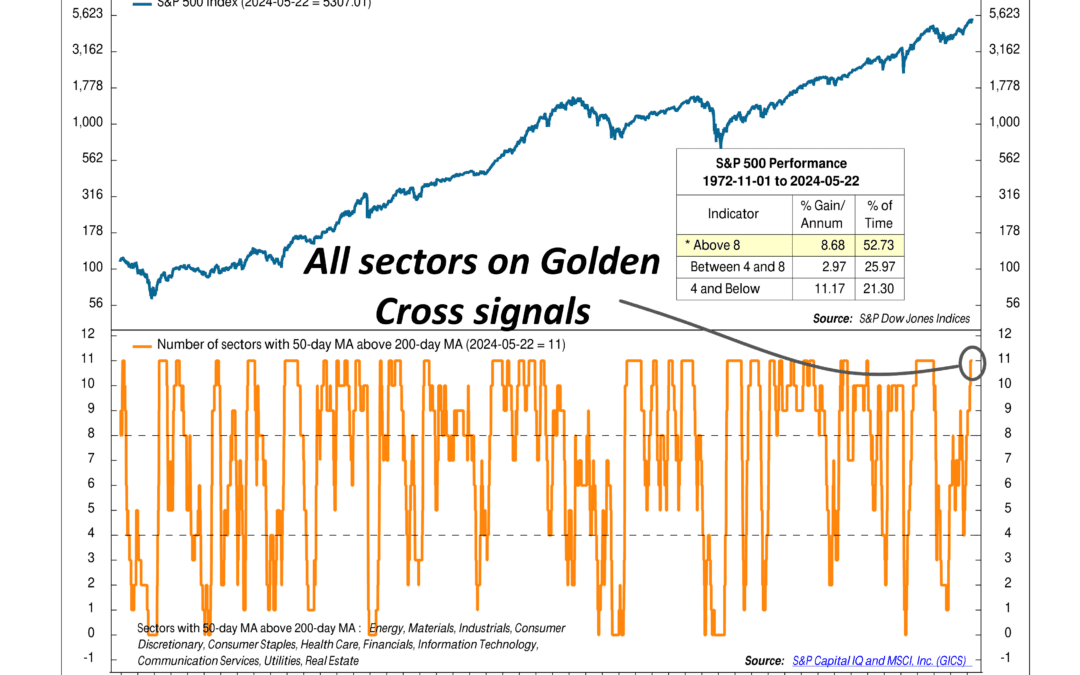
by NelsonCorp Wealth Management | May 23, 2024 | Indicator Insights
This week’s indicator uses a tool called a golden cross. A golden cross happens when a financial asset’s short-term moving average crosses above its long-term moving average, signaling a bullish trend with increasing momentum. Typically, we look at the...
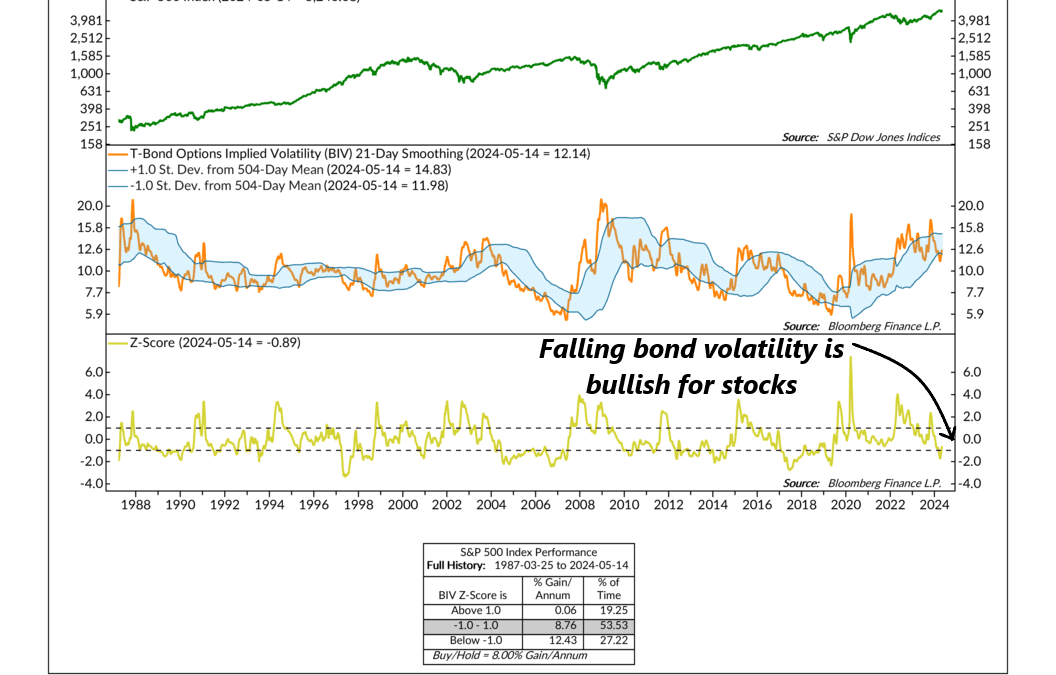
by NelsonCorp Wealth Management | May 16, 2024 | Indicator Insights
We’ve talked about stock market volatility in the past and how we can use tools like the VIX Index to gauge stock market risk. But what about bond market volatility? Can that be used to call stocks? The answer, according to this week’s indicator, is yes! The...