by NelsonCorp Wealth Management | Jun 22, 2023 | Indicator Insights
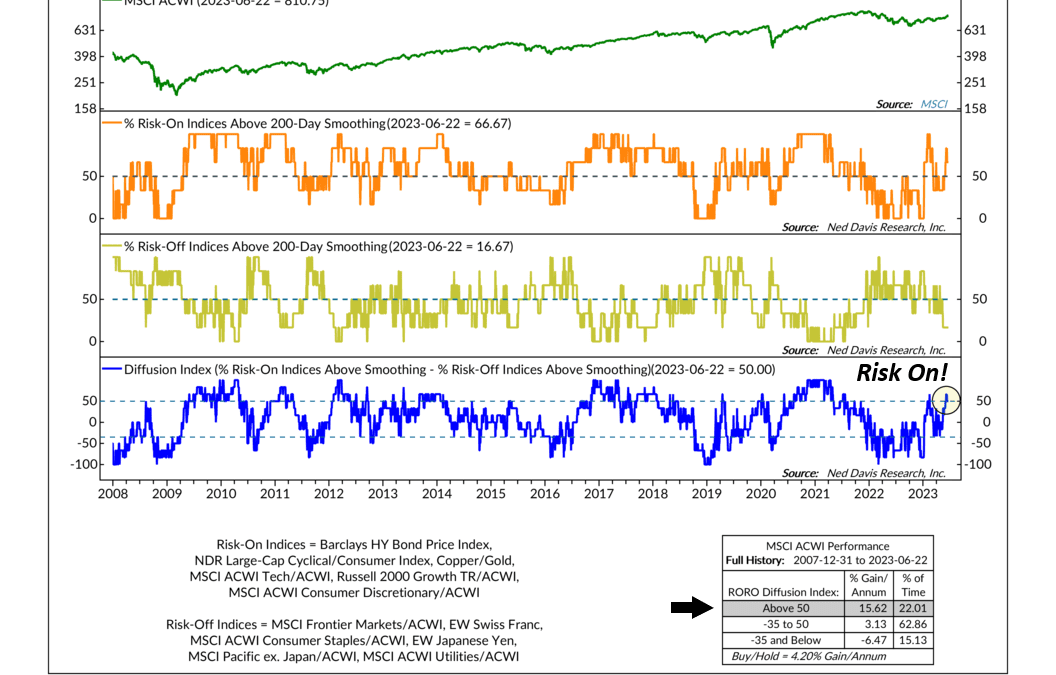
This week’s indicator is called the Risk-On/Risk-Off Indicator, or RO/RO indicator for short. It’s designed to gauge the relative risk tolerance in the investments landscape. In other words, it is a gauge of economic confidence. The Risk-On Index, shown in the...
by NelsonCorp Wealth Management | Jun 15, 2023 | Indicator Insights
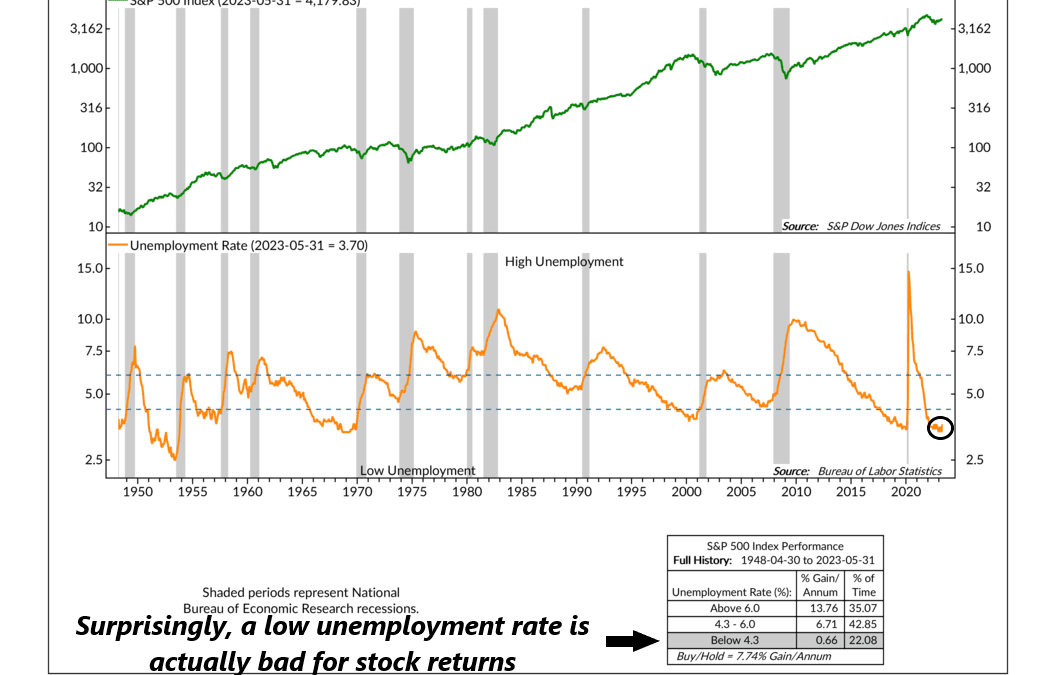
The unemployment rate is the one economic indicator most people are likely familiar with. To state the obvious, we don’t like a high unemployment rate; it means people are out of a job, and that’s not good for anyone. But this week’s featured indicator shows...
by NelsonCorp Wealth Management | Jun 8, 2023 | Indicator Insights
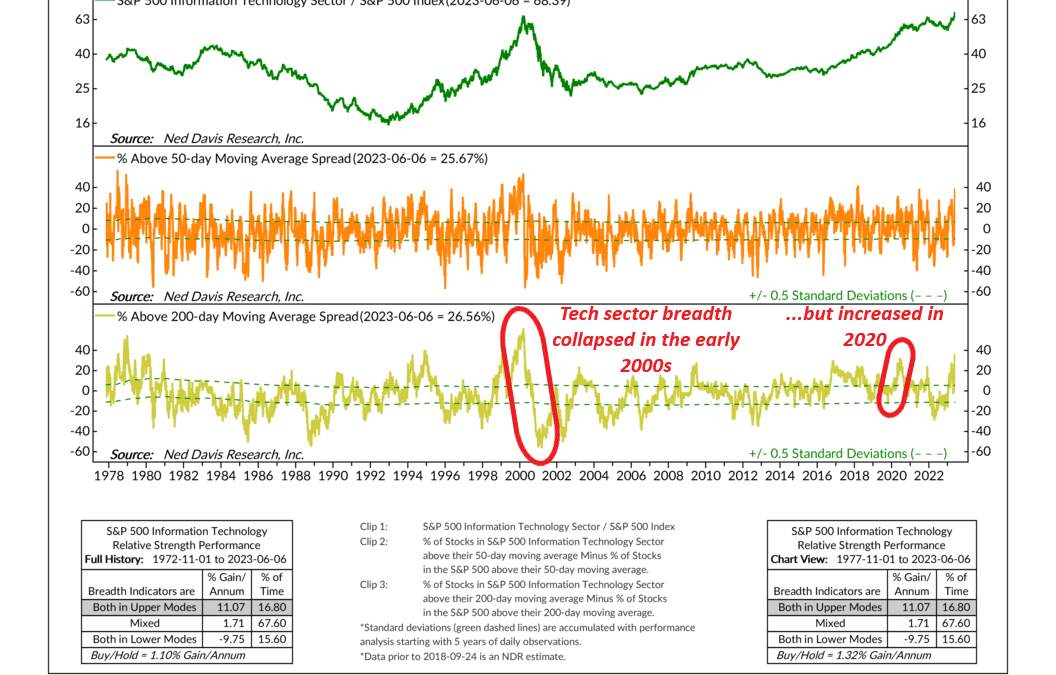
In 2023, the stock market has been largely influenced by the Technology sector, which has emerged as the best-performing sector within the S&P 500. Indeed, approximately 90% of the S&P 500’s gains this year can be attributed solely to the...
by NelsonCorp Wealth Management | Jun 1, 2023 | Indicator Insights
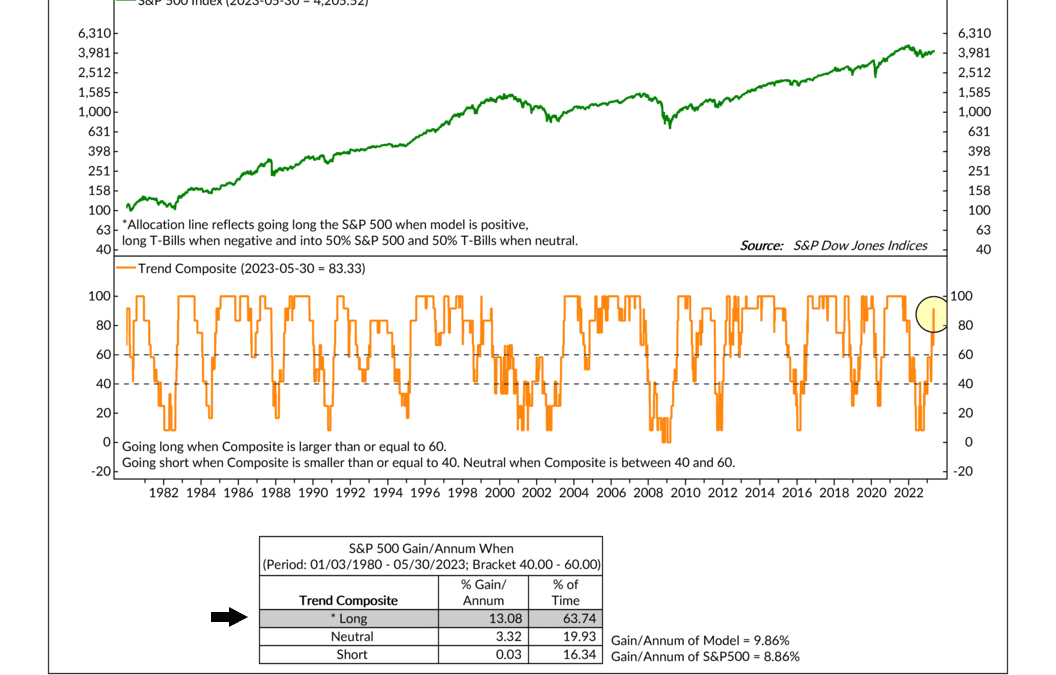
Investors often find themselves confused and overwhelmed amid the vast sea of financial information. That’s why we rely on a few fundamental investing principles to navigate our decision-making process. One such principle has to do with the importance of...
by NelsonCorp Wealth Management | May 25, 2023 | Indicator Insights
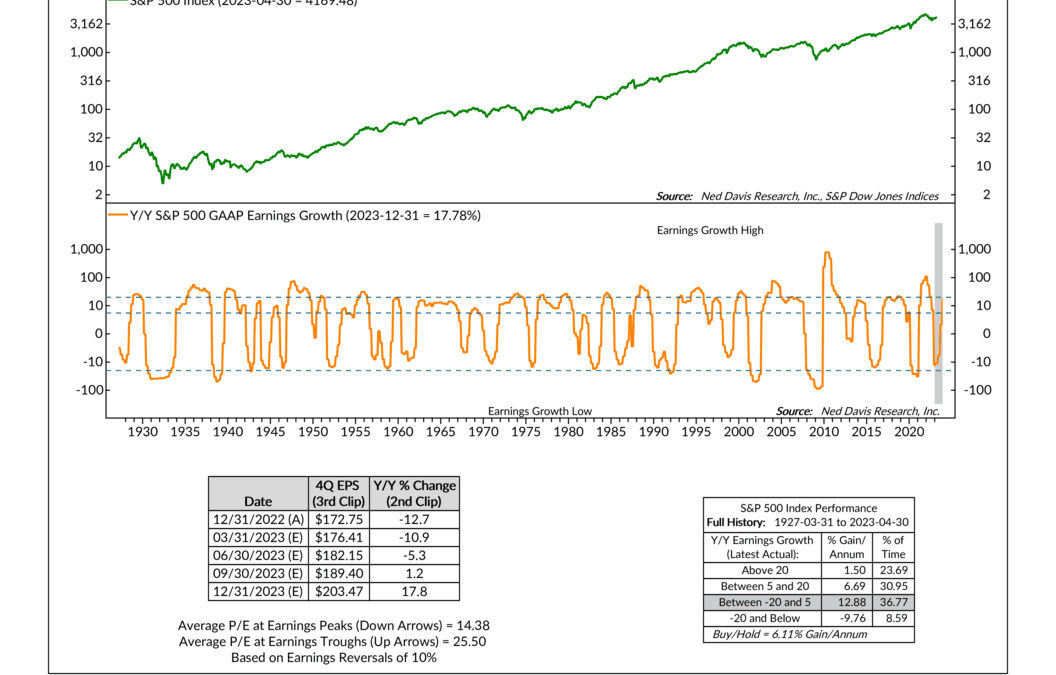
For this week’s indicator, we’re going to take a look at stock market earnings and how they can be used to forecast stock market returns. In the top part of the chart above, we have plotted the S&P 500 Index’s monthly close (green line), which we’ll be...
by NelsonCorp Wealth Management | May 18, 2023 | Indicator Insights
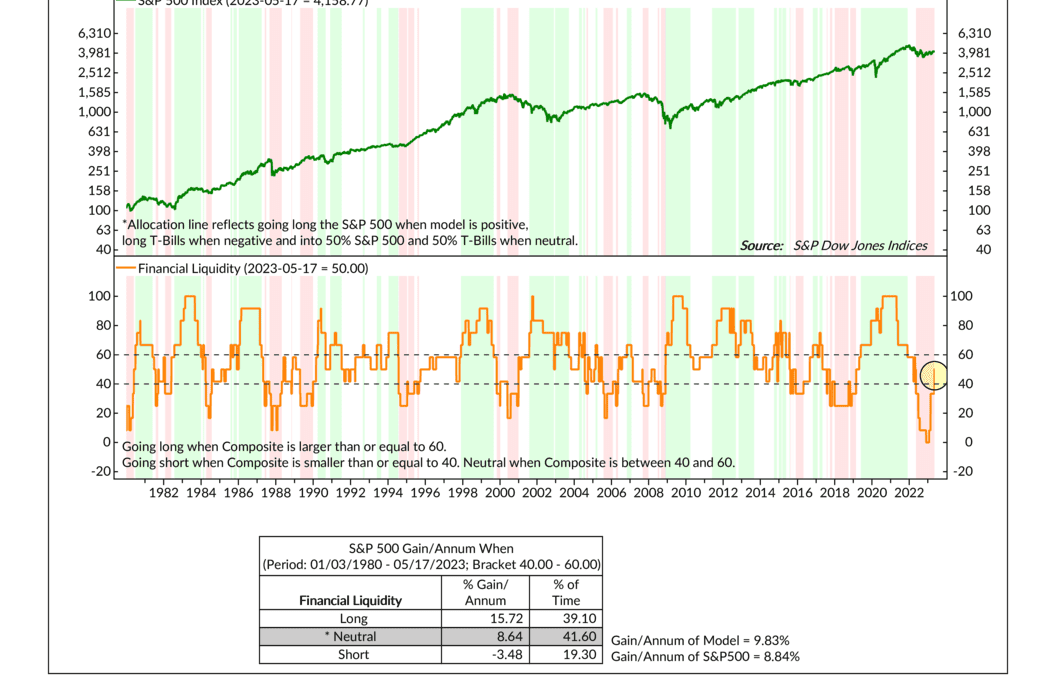
There’s this amusing scene in the 2000 movie Boiler Room where Ben Affleck’s character boasts about his wealth to a room full of interns. He proudly mentions his luxurious car, beautiful house, and most importantly, he says, “I am liquid.” By...


