by NelsonCorp | Feb 12, 2026 | Indicator Insights
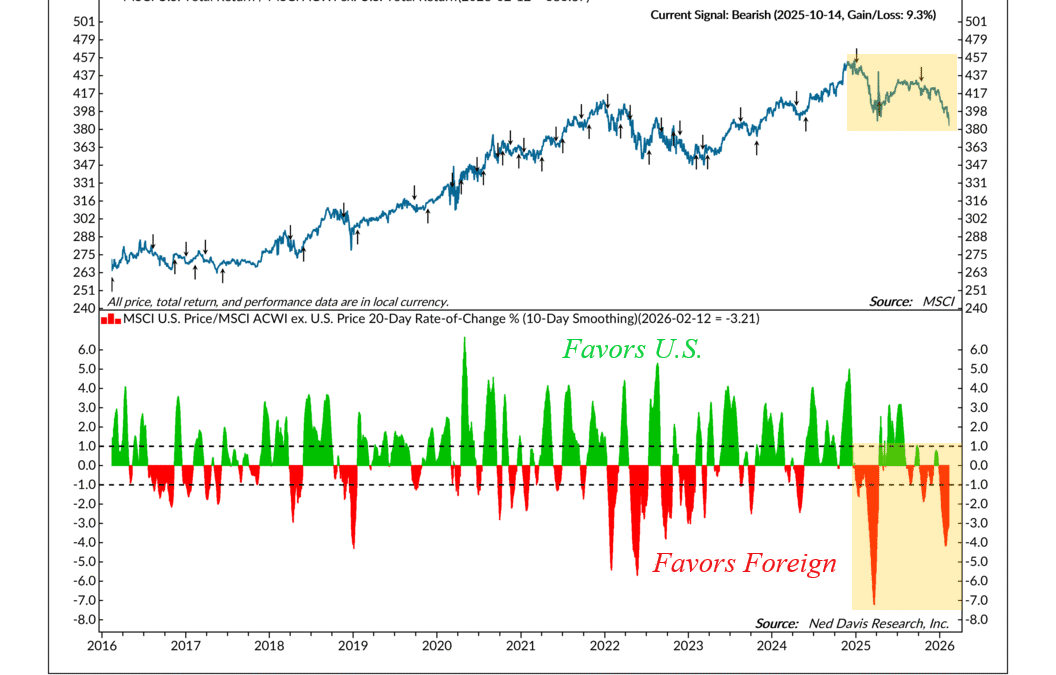
I like to call this week’s featured indicator the “Stay Home or Go Global” indicator. This is because it measures the relative strength of the U.S. stock market versus the global stock market. Here’s the basic idea. The top portion of the chart shows the ratio...
by NelsonCorp | Feb 5, 2026 | Indicator Insights
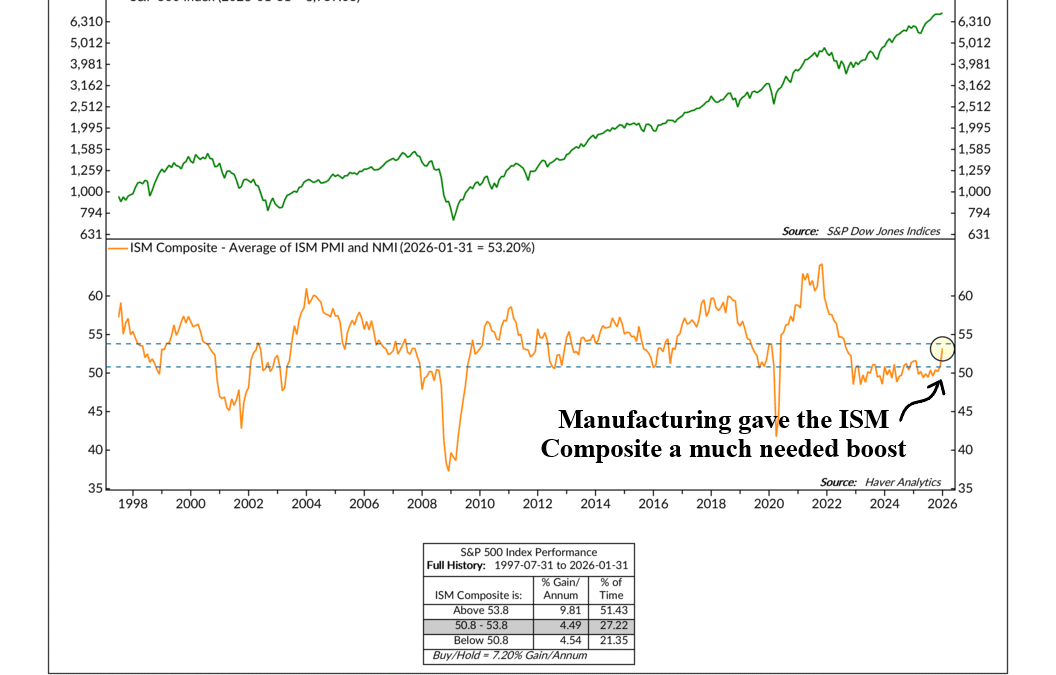
The good news on Wall Street this week came from a place that has been stuck in the mud for a while: manufacturing. The latest Institute for Supply Management Manufacturing index jumped to 52.6, up from 47.9 previously. This was significant for a couple of...
by NelsonCorp | Jan 29, 2026 | Indicator Insights
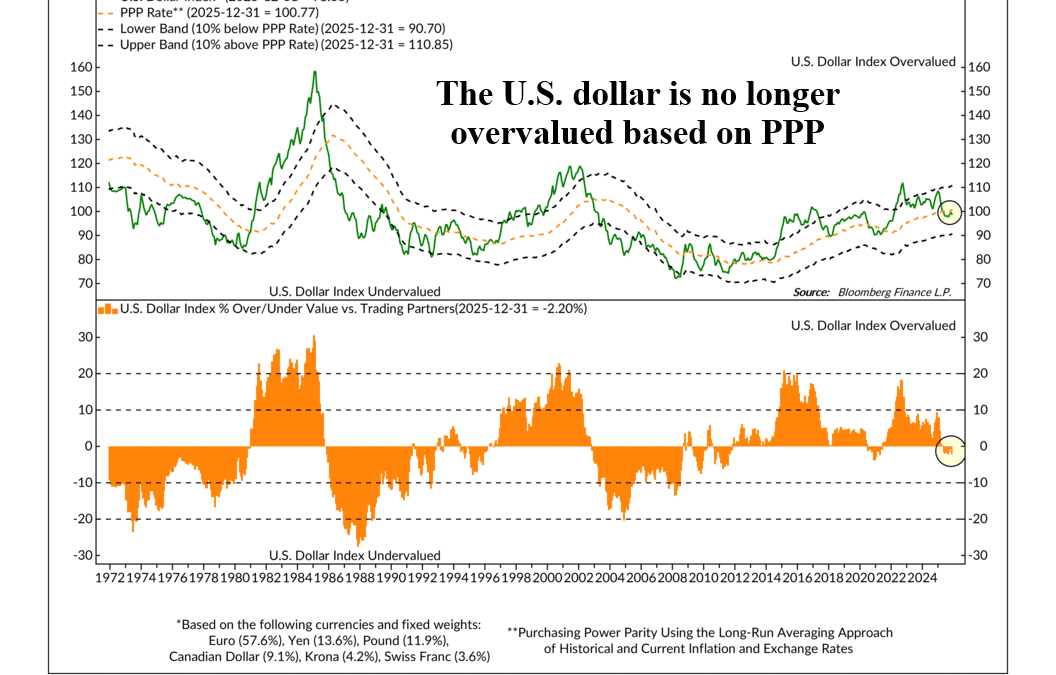
The U.S. dollar has been in the news a lot lately. Mainly because it’s been falling—a lot. Last year, the ICE U.S. Dollar Index, the benchmark index for the U.S. dollar, fell roughly 10%. This year, it’s already down another 2%. But should we really be...
by NelsonCorp | Jan 22, 2026 | Indicator Insights
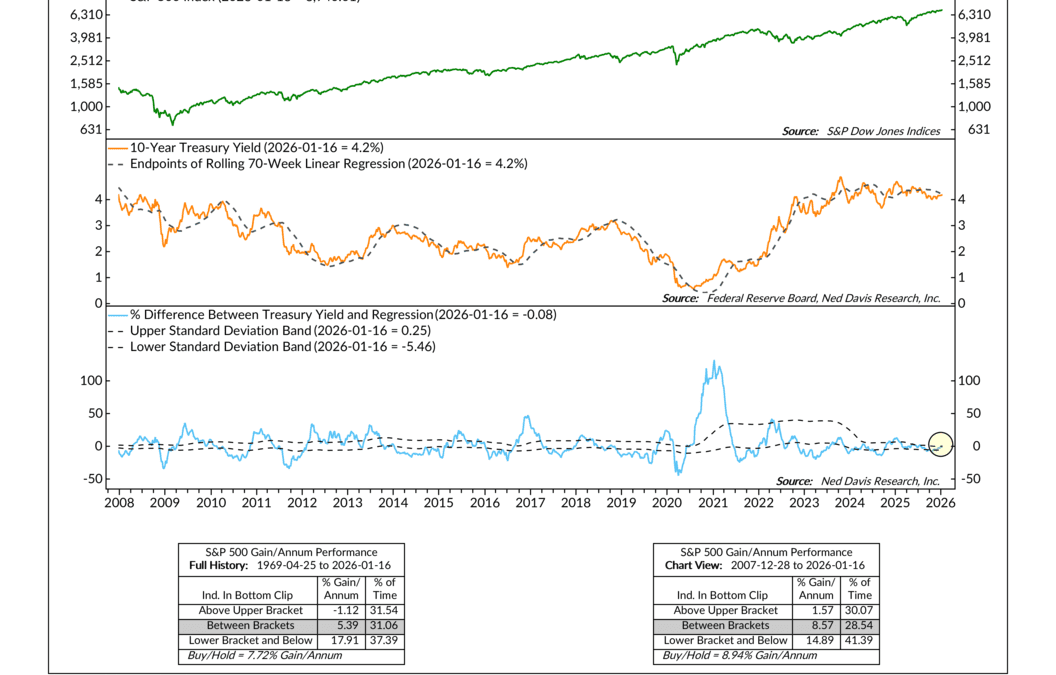
Interest rates are important for the stock market. In a technical sense, they’re what we call the “discount rate.” This is the rate at which the future cash flows generated by the companies in the stock market get discounted back to the present. Because of how...
by NelsonCorp | Jan 15, 2026 | Indicator Insights
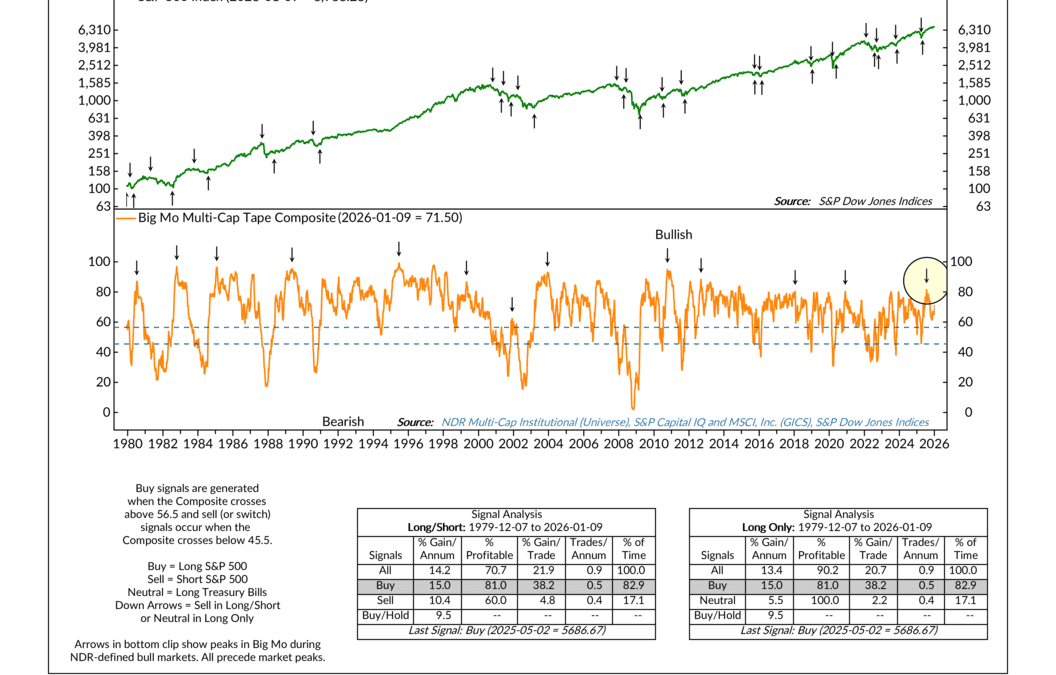
Momentum can be an interesting thing to measure in markets. Due to the nature of how momentum is calculated (a rate of change), it often tends to fade before prices actually peak. Think of it like a homemade rocket. The speed at which it’s rising slows down...
by NelsonCorp | Jan 8, 2026 | Indicator Insights
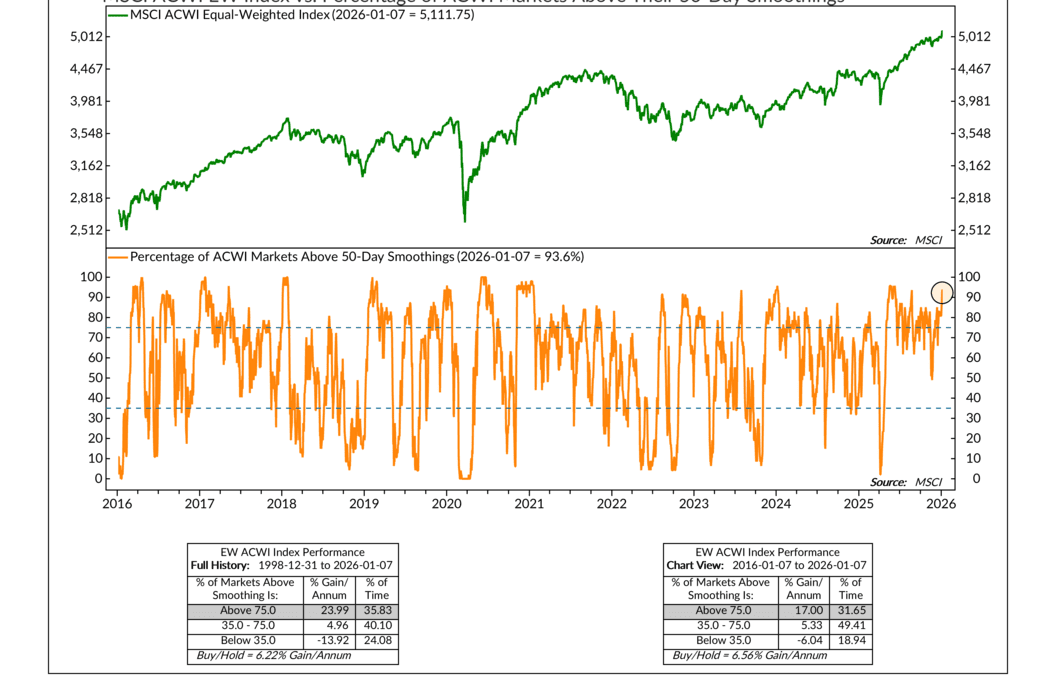
Coming into the new year, we wanted to see markets answer one simple question: Are stocks moving together, or is the rally being carried by just a handful of names? That distinction matters more than most investors realize. Broad participation is often the...