by NelsonCorp | Jan 1, 2026 | Indicator Insights
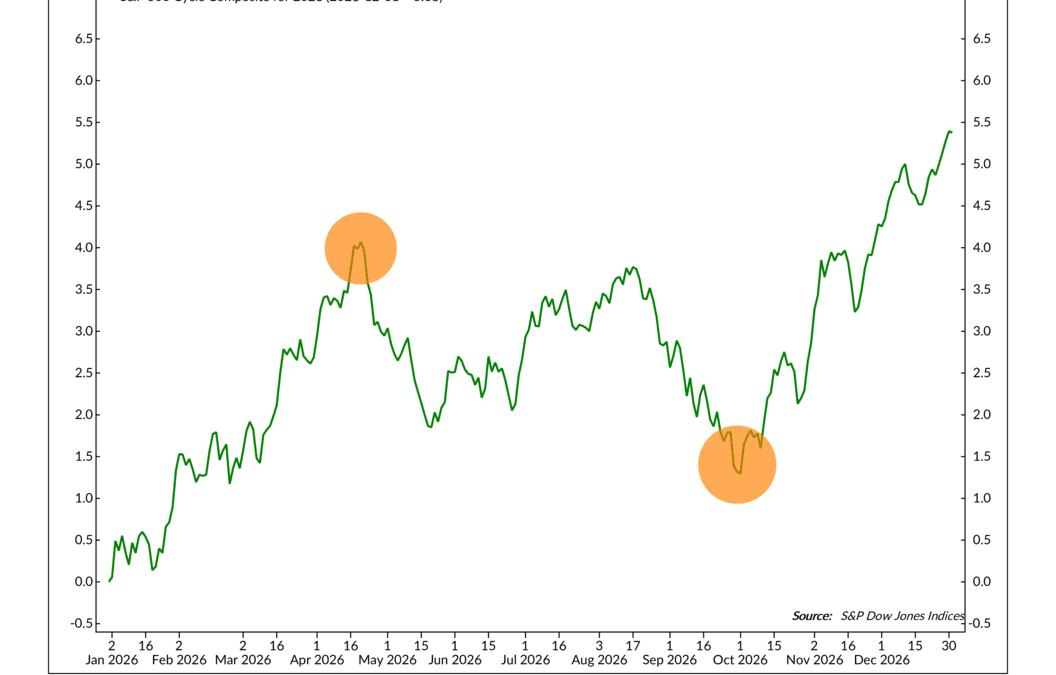
Today officially marks the first day of the new year, so let’s take a look at the NDR Cycle Composite for 2026 to see what the new year has in store for us. Now, this is one of the tools we use to help set expectations, not to make predictions. It’s based...
by NelsonCorp | Dec 25, 2025 | Indicator Insights
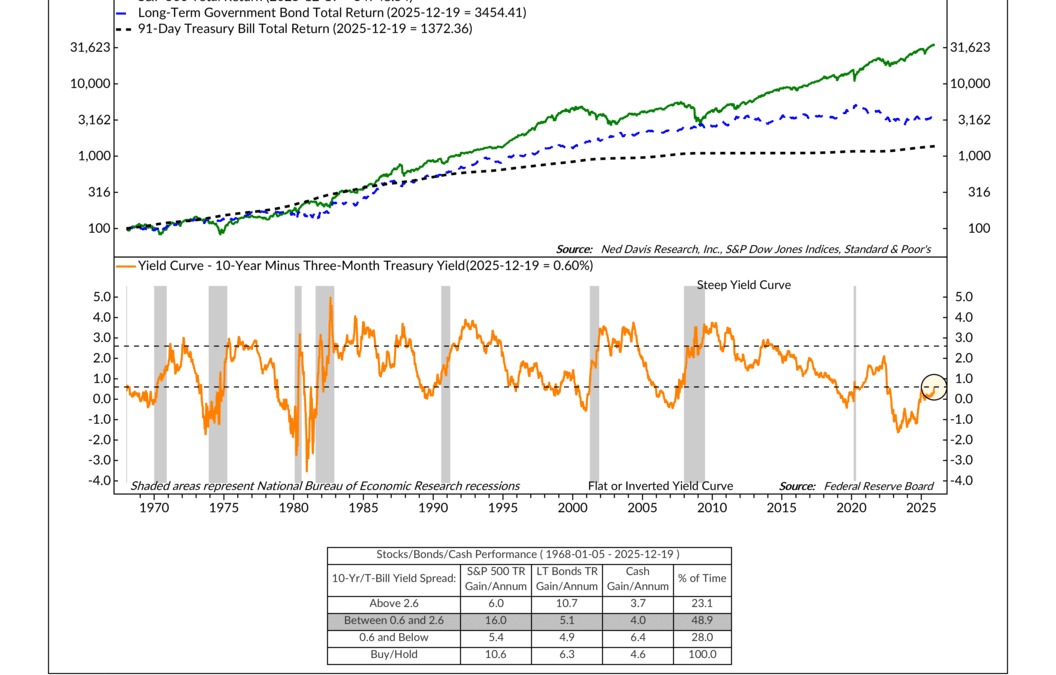
For this week’s indicator, we’re looking at a simple but powerful signal from the bond market called the yield curve. Don’t let the name scare you off. At its core, this indicator just compares two interest rates: the yield on a 10-year U.S. Treasury bond and...
by NelsonCorp | Dec 18, 2025 | Indicator Insights
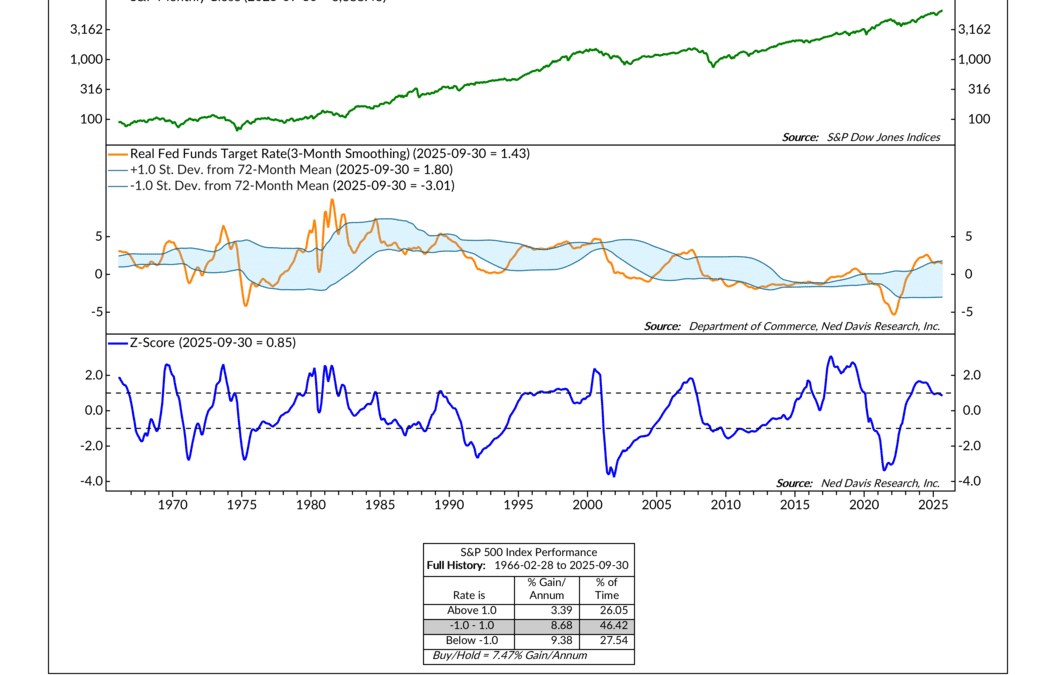
A lot of the time, when talking about interest rates, we talk in nominal terms. Treasury yields, mortgage rates, whatever—the stated, headline rate is the nominal rate. These matter, because they are what borrowers actually pay and lenders actually receive....
by NelsonCorp | Dec 11, 2025 | Indicator Insights
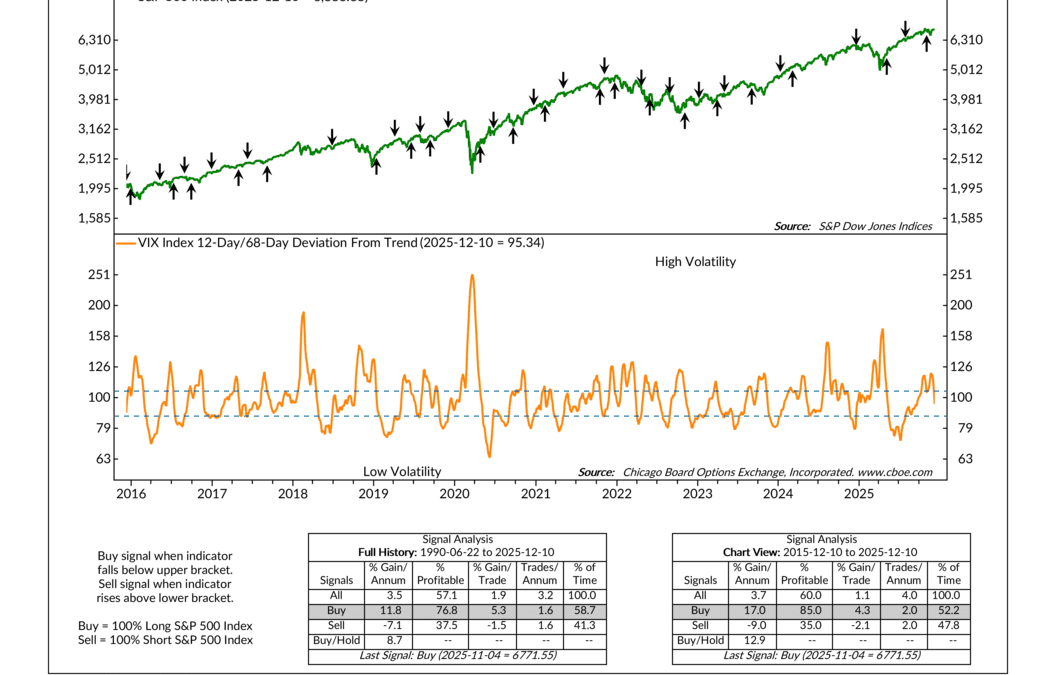
In the past we’ve talked about volatility and the different ways of measuring it. The VIX, or Wall Street’s “Fear Index,” is a popular measure because it tells us how much investors expect the stock market to swing over the coming month. It measures implied,...
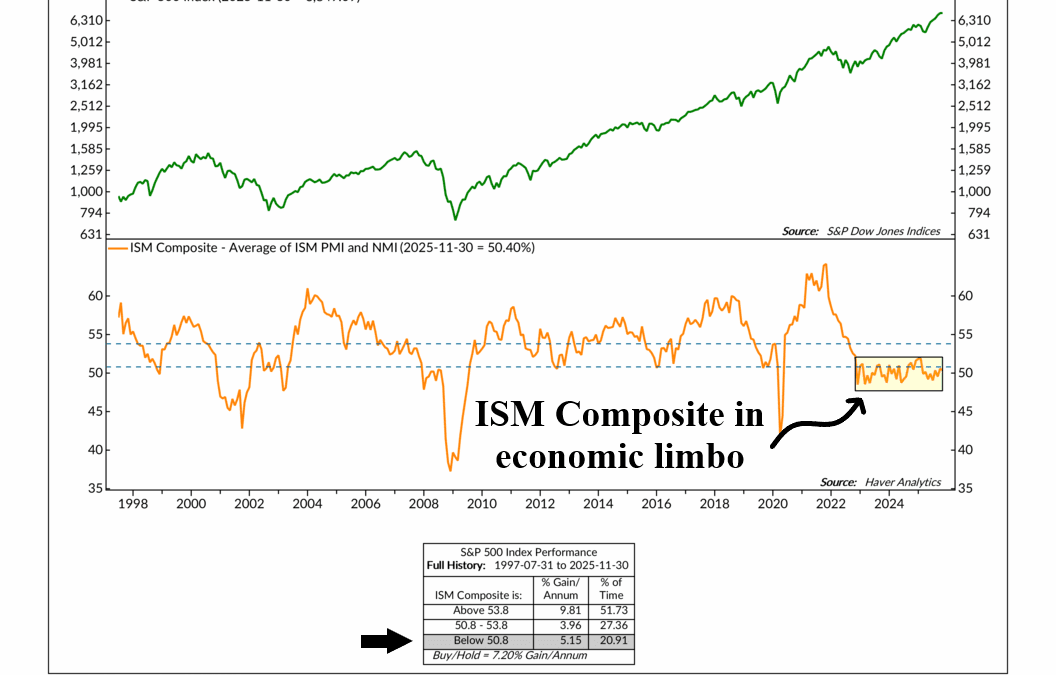
by NelsonCorp | Dec 4, 2025 | Indicator Insights
Every month the Institute for Supply Management releases two surveys that describe the state of the U.S. economy. One measures manufacturing activity and the other measures services. Average them together and you get what we call the ISM Composite Index, shown...
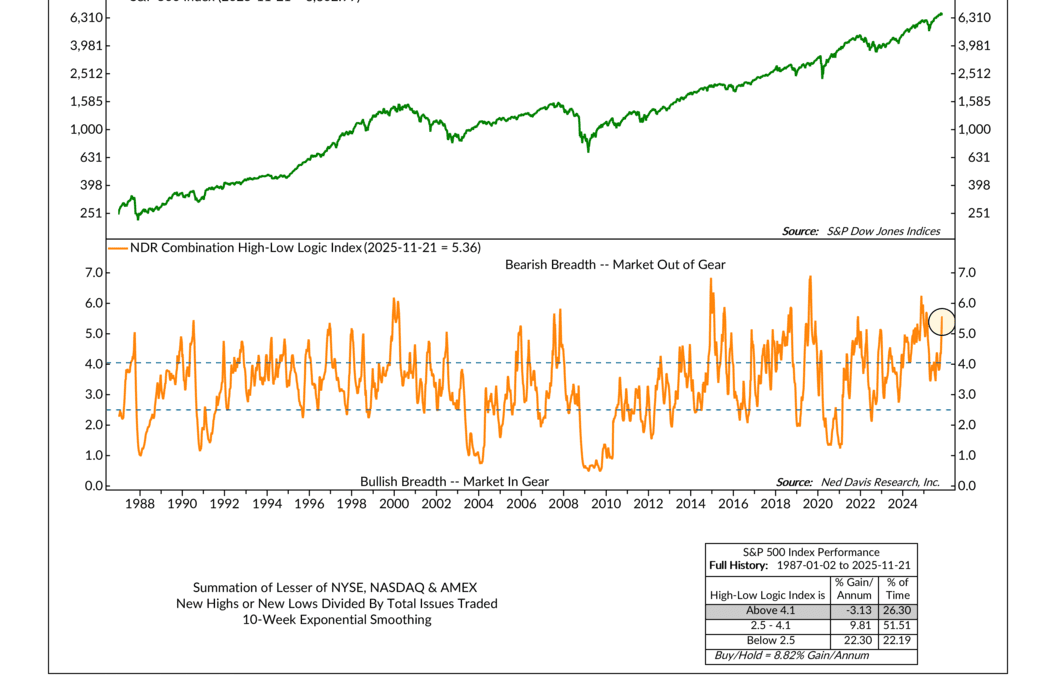
by NelsonCorp | Nov 26, 2025 | Indicator Insights
At first glance, the stock market seems pretty straightforward. If plenty of stocks are hitting new highs, that’s bullish. If plenty are hitting new lows, that’s bearish. But what happens when a lot of stocks are making new highs and new lows at the same time?...