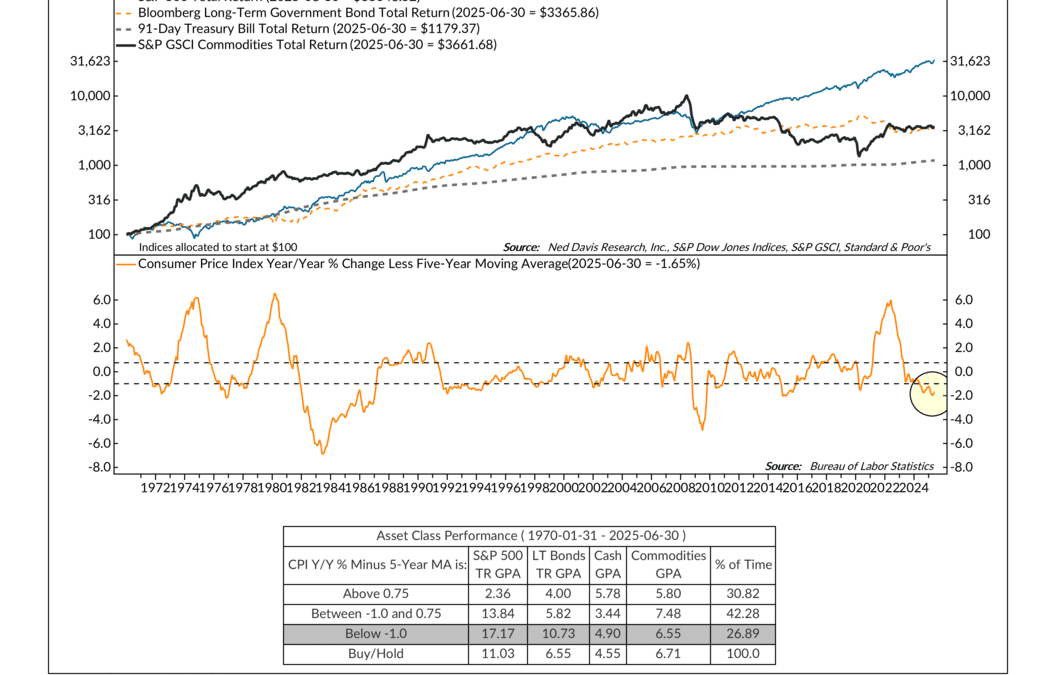
by NelsonCorp | Jul 17, 2025 | Indicator Insights
This week’s indicator looks at how different asset classes tend to perform depending on whether inflation is running hot or cool. By comparing inflation to its five-year trend, it offers a clearer picture of which environments have historically favored stocks, bonds, cash, or commodities.
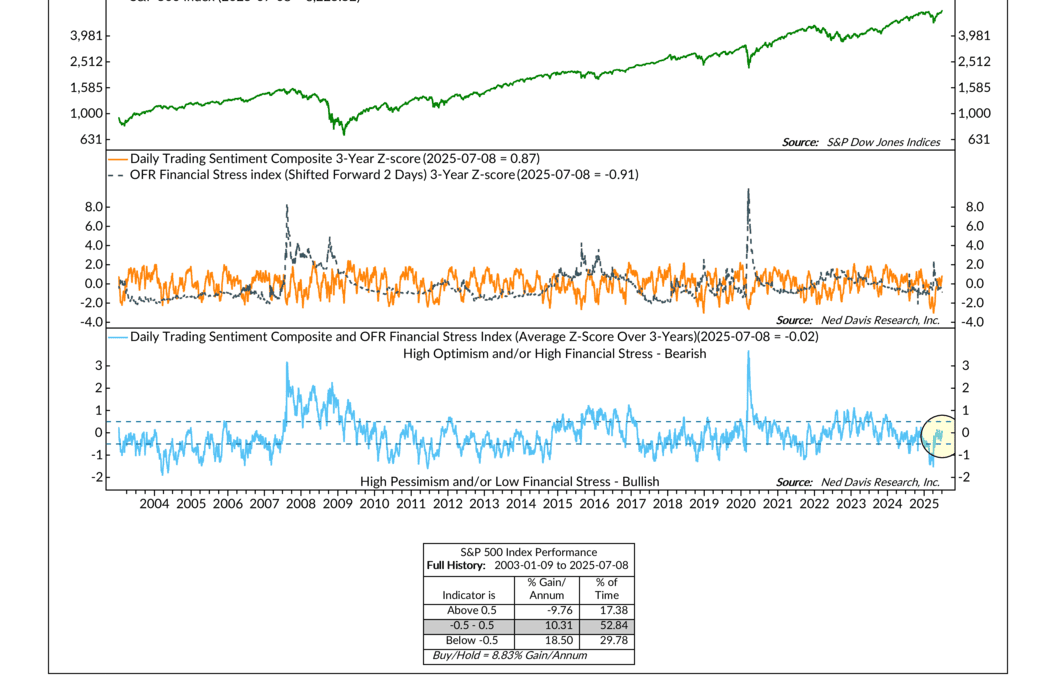
by NelsonCorp | Jul 10, 2025 | Indicator Insights
Investors may seem overly optimistic, but context matters—easy financial conditions can make even high sentiment less dangerous. This week’s indicator blends emotion with environment, giving us a clearer view of whether sentiment is truly stretched or just seems that way.
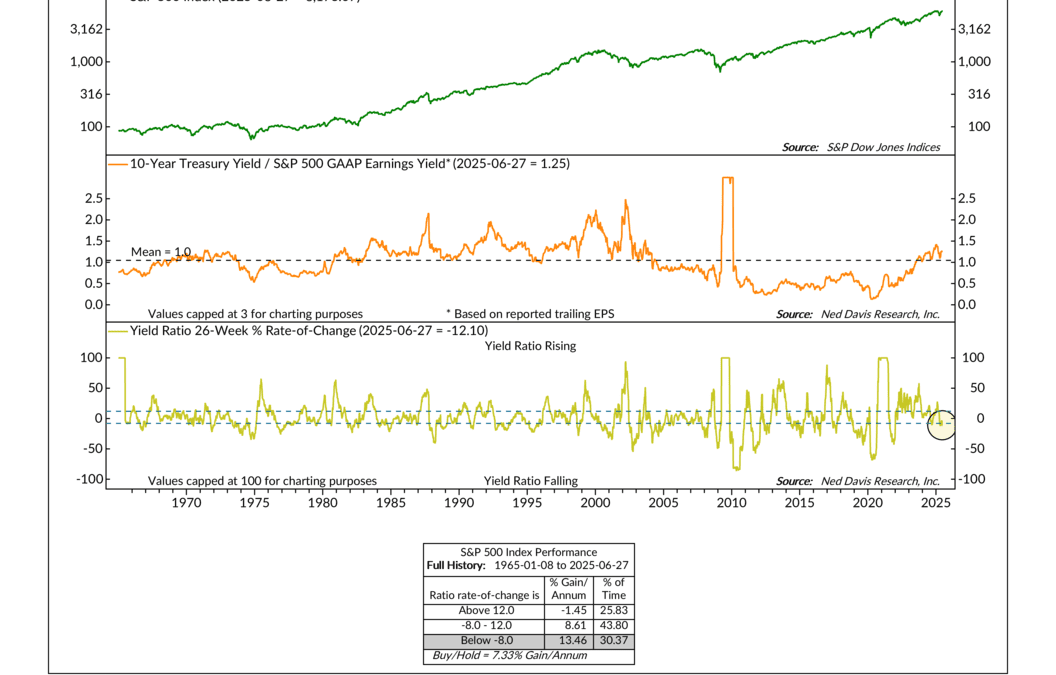
by NelsonCorp | Jul 3, 2025 | Indicator Insights
Is the stock market actually expensive—or just pricier than we’re used to? This week’s indicator puts stocks and bonds head-to-head to give us a clearer view of relative value.
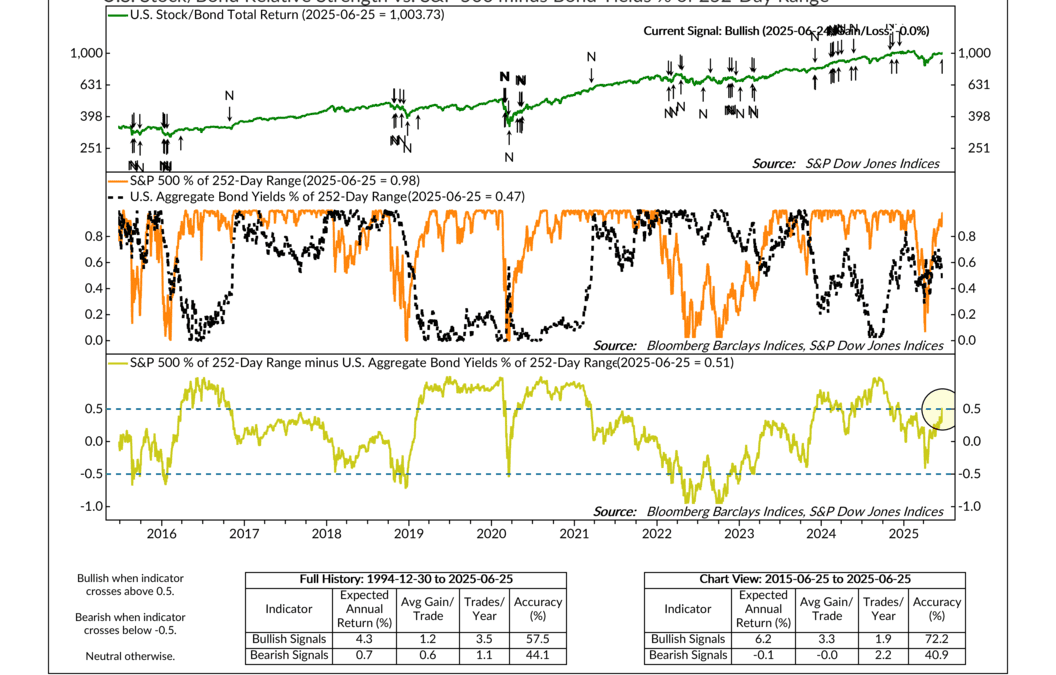
by NelsonCorp | Jun 26, 2025 | Indicator Insights
Stocks or bonds? It’s a question every investor wrestles with sooner or later. Check out this week’s indicator, where the battle of the benchmarks is heating up—and a new signal could tilt the field.
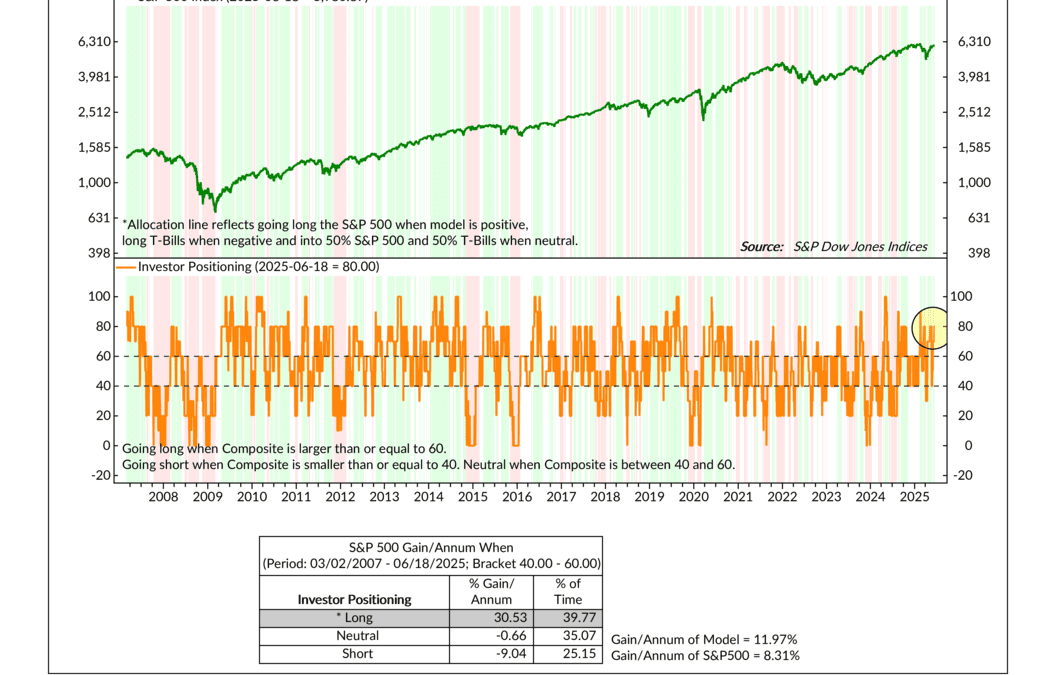
by NelsonCorp | Jun 19, 2025 | Indicator Insights
Investor surveys tell us what people say—but this week’s featured indicator looks at what they do with their money. With 80% of our positioning signals flashing bullish, history suggests that widespread caution may be setting the stage for further gains.
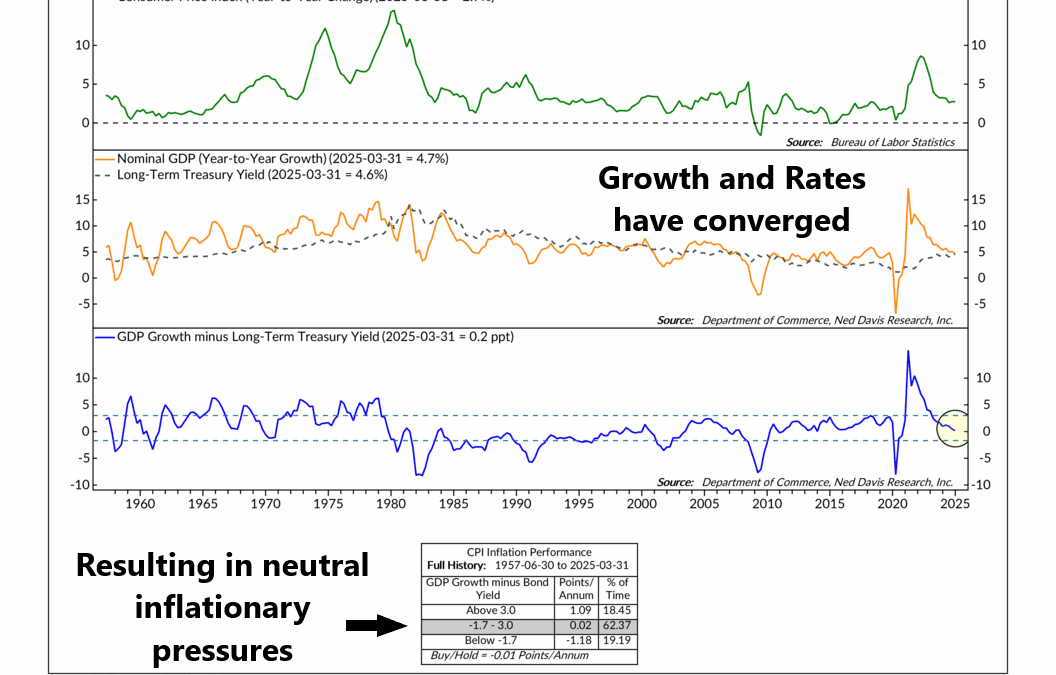
by NelsonCorp | Jun 12, 2025 | Indicator Insights
Check out this week’s indicator, which tracks the tug-of-war between economic growth and interest rates and acts like a pressure gauge for inflation. Which side is winning can reveal a lot about where prices might be headed next.