by NelsonCorp Wealth Management | Mar 20, 2025 | Indicator Insights
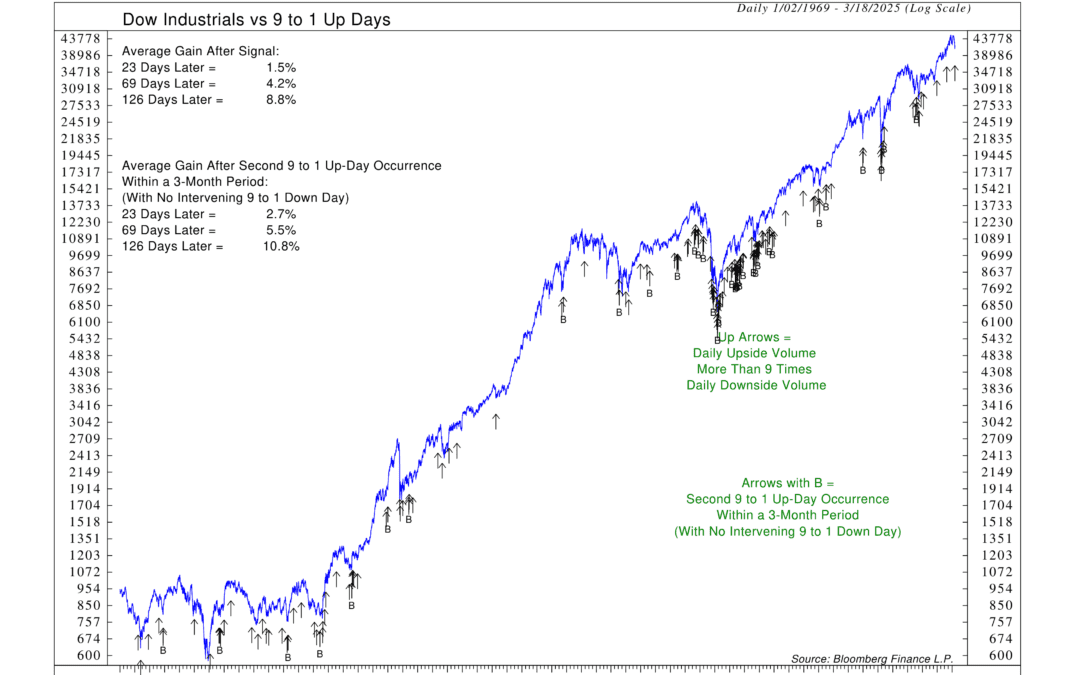
When the stock market is down, we have a few tools in our toolkit that we use to gauge when the selling might be over. This week’s indicator, measuring 9-to-1 Up Days, is one of them. It produces a somewhat rare but historically important signal that tends to...

by NelsonCorp Wealth Management | Mar 13, 2025 | Indicator Insights
Markets don’t go up forever. Occasionally, they hit a wall. Recently, the U.S. stock market has done just that, leaving many investors wondering: is momentum slowing down? Just how overbought was the market? Is a larger downturn coming? This week’s featured...
by NelsonCorp Wealth Management | Mar 6, 2025 | Indicator Insights
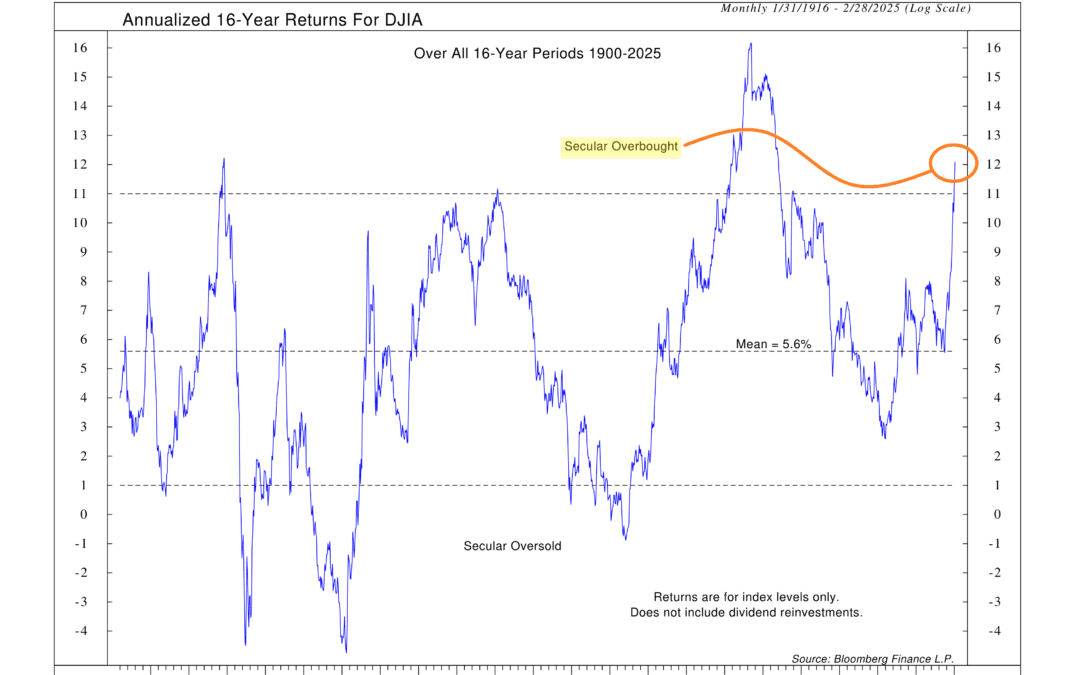
Markets have a way of pulling investors in at the worst times and scaring them away when the best opportunities appear. When things look good, people expect them to stay that way. When things look bad, they assume they’ll never improve. But history tells a...
by NelsonCorp Wealth Management | Feb 27, 2025 | Indicator Insights
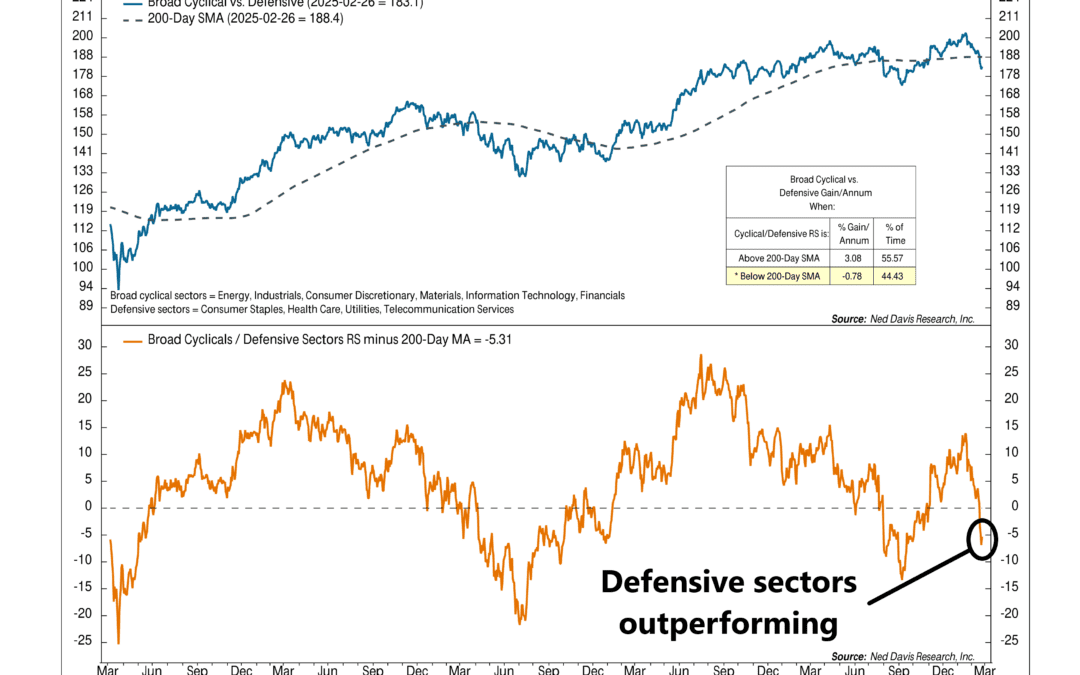
Everything is relative. Sure, you’ve probably heard that before. But it holds true in the stock market, too. Relative strength isn’t about measuring something in isolation. It’s about how it performs compared to something else—a benchmark. Think of it like...
by NelsonCorp Wealth Management | Feb 20, 2025 | Indicator Insights
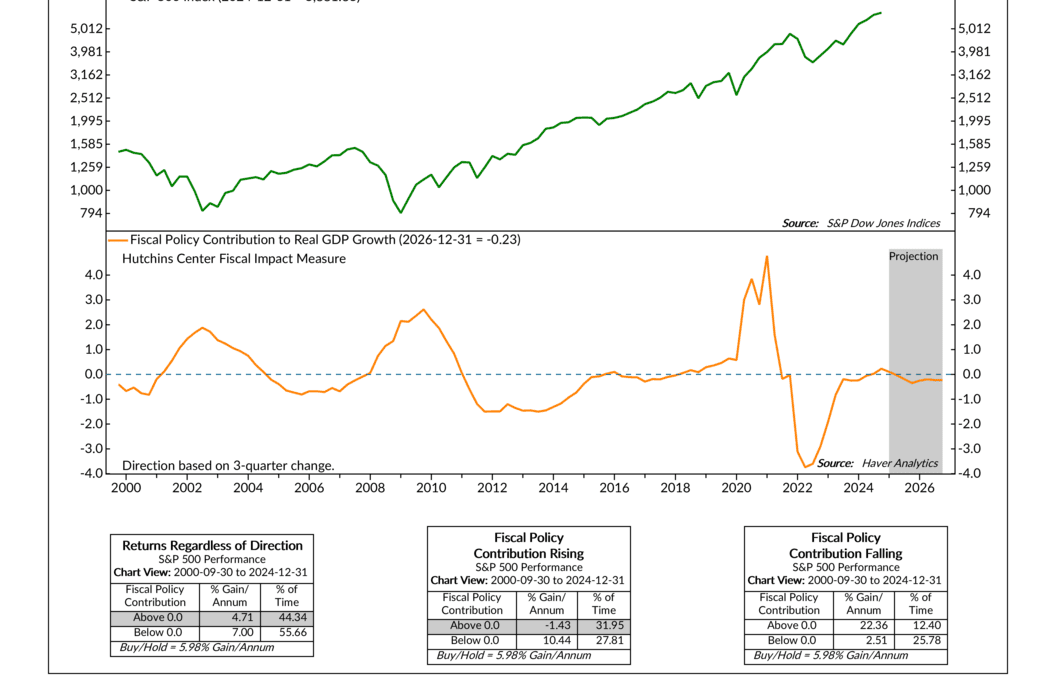
One of the biggest drivers of economic growth is government spending. But here’s the funny thing— as this week’s featured indicator reveals, that spending doesn’t always have the same effect on the stock market. The blue line at the top of the chart tracks the...
by NelsonCorp Wealth Management | Feb 13, 2025 | Indicator Insights
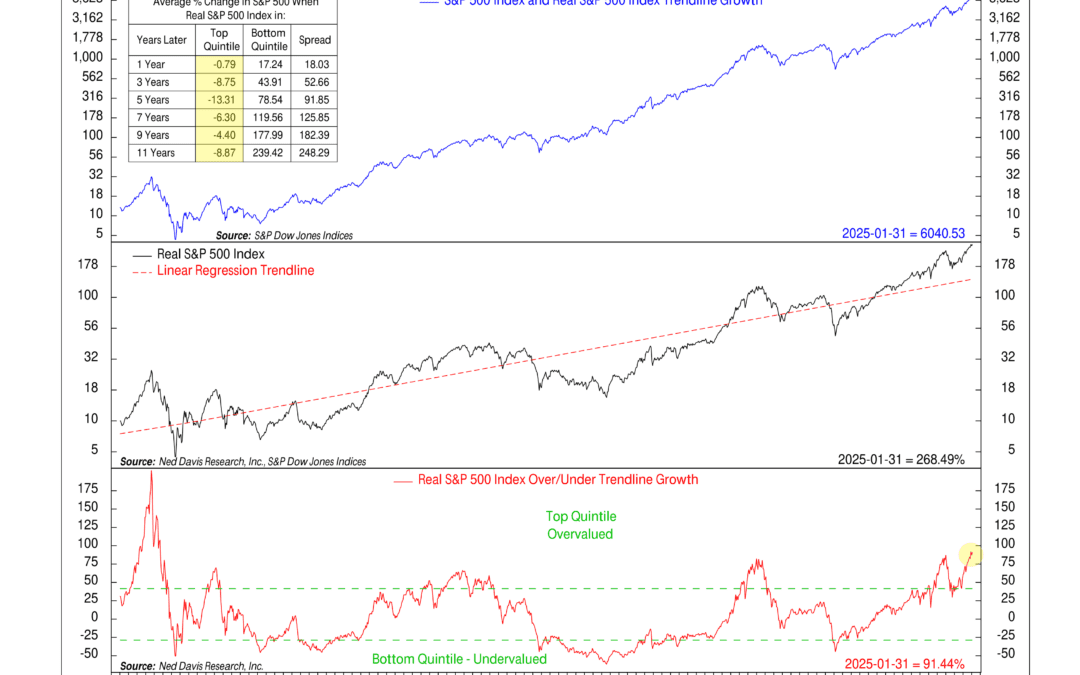
The S&P 500 has been on a relentless climb, and today, it’s sitting far above its long-term historical trend. The market has a way of moving in cycles—sometimes running hot, sometimes cooling off—but over the long run, it tends to follow a fundamental...


