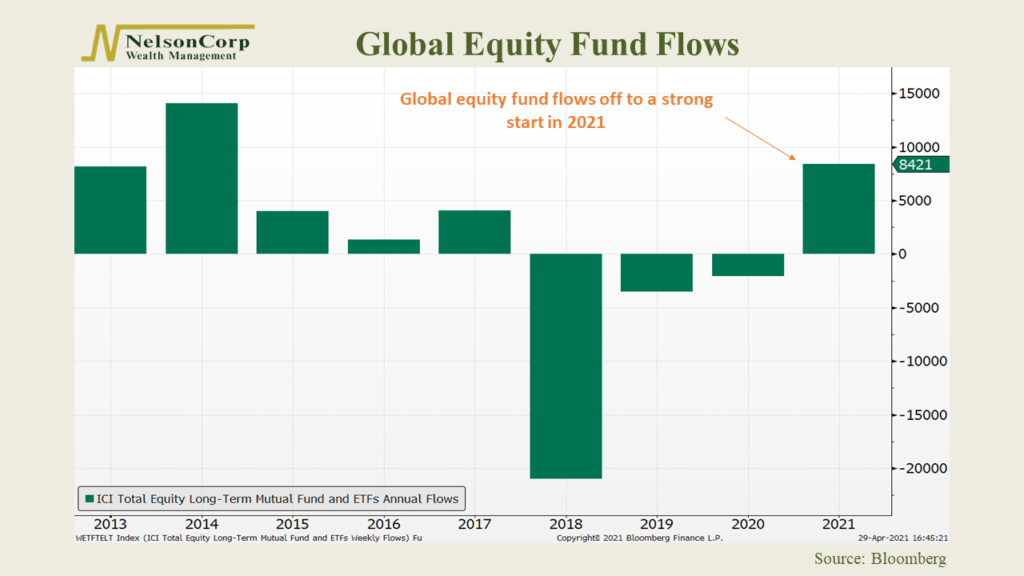
The week’s featured chart shows the total annual flows into global equity (stock) funds going back to 2013. Fund flows are simply the net cash inflow into a fund (purchases) or net cash outflow from a fund (redemptions), regardless of performance.
When an equity fund has a net cash inflow, it means the fund’s managers have more cash on hand to buy holdings. But if the fund has net cash outflows, the opposite is true: fund managers must sell out of positions to cover redemptions. The takeaway: fund flow data can indicate higher or lower demand for equities based solely on the day-to-day operations of equity fund managers.
The chart above shows that the amount of money flowing into global equity funds has jumped significantly this year. Flows are positive for the first time since 2017 and the highest since 2014. Even more remarkable is that this only represents the first four months of the year. If flows continue at such a strong pace, this year could register the highest fund flows on record since this series started in 2013.
This is intended for informational purposes only and should not be used as the primary basis for an investment decision. Consult an advisor for your personal situation.
Indices mentioned are unmanaged, do not incur fees, and cannot be invested into directly.
Past performance does not guarantee future results.
