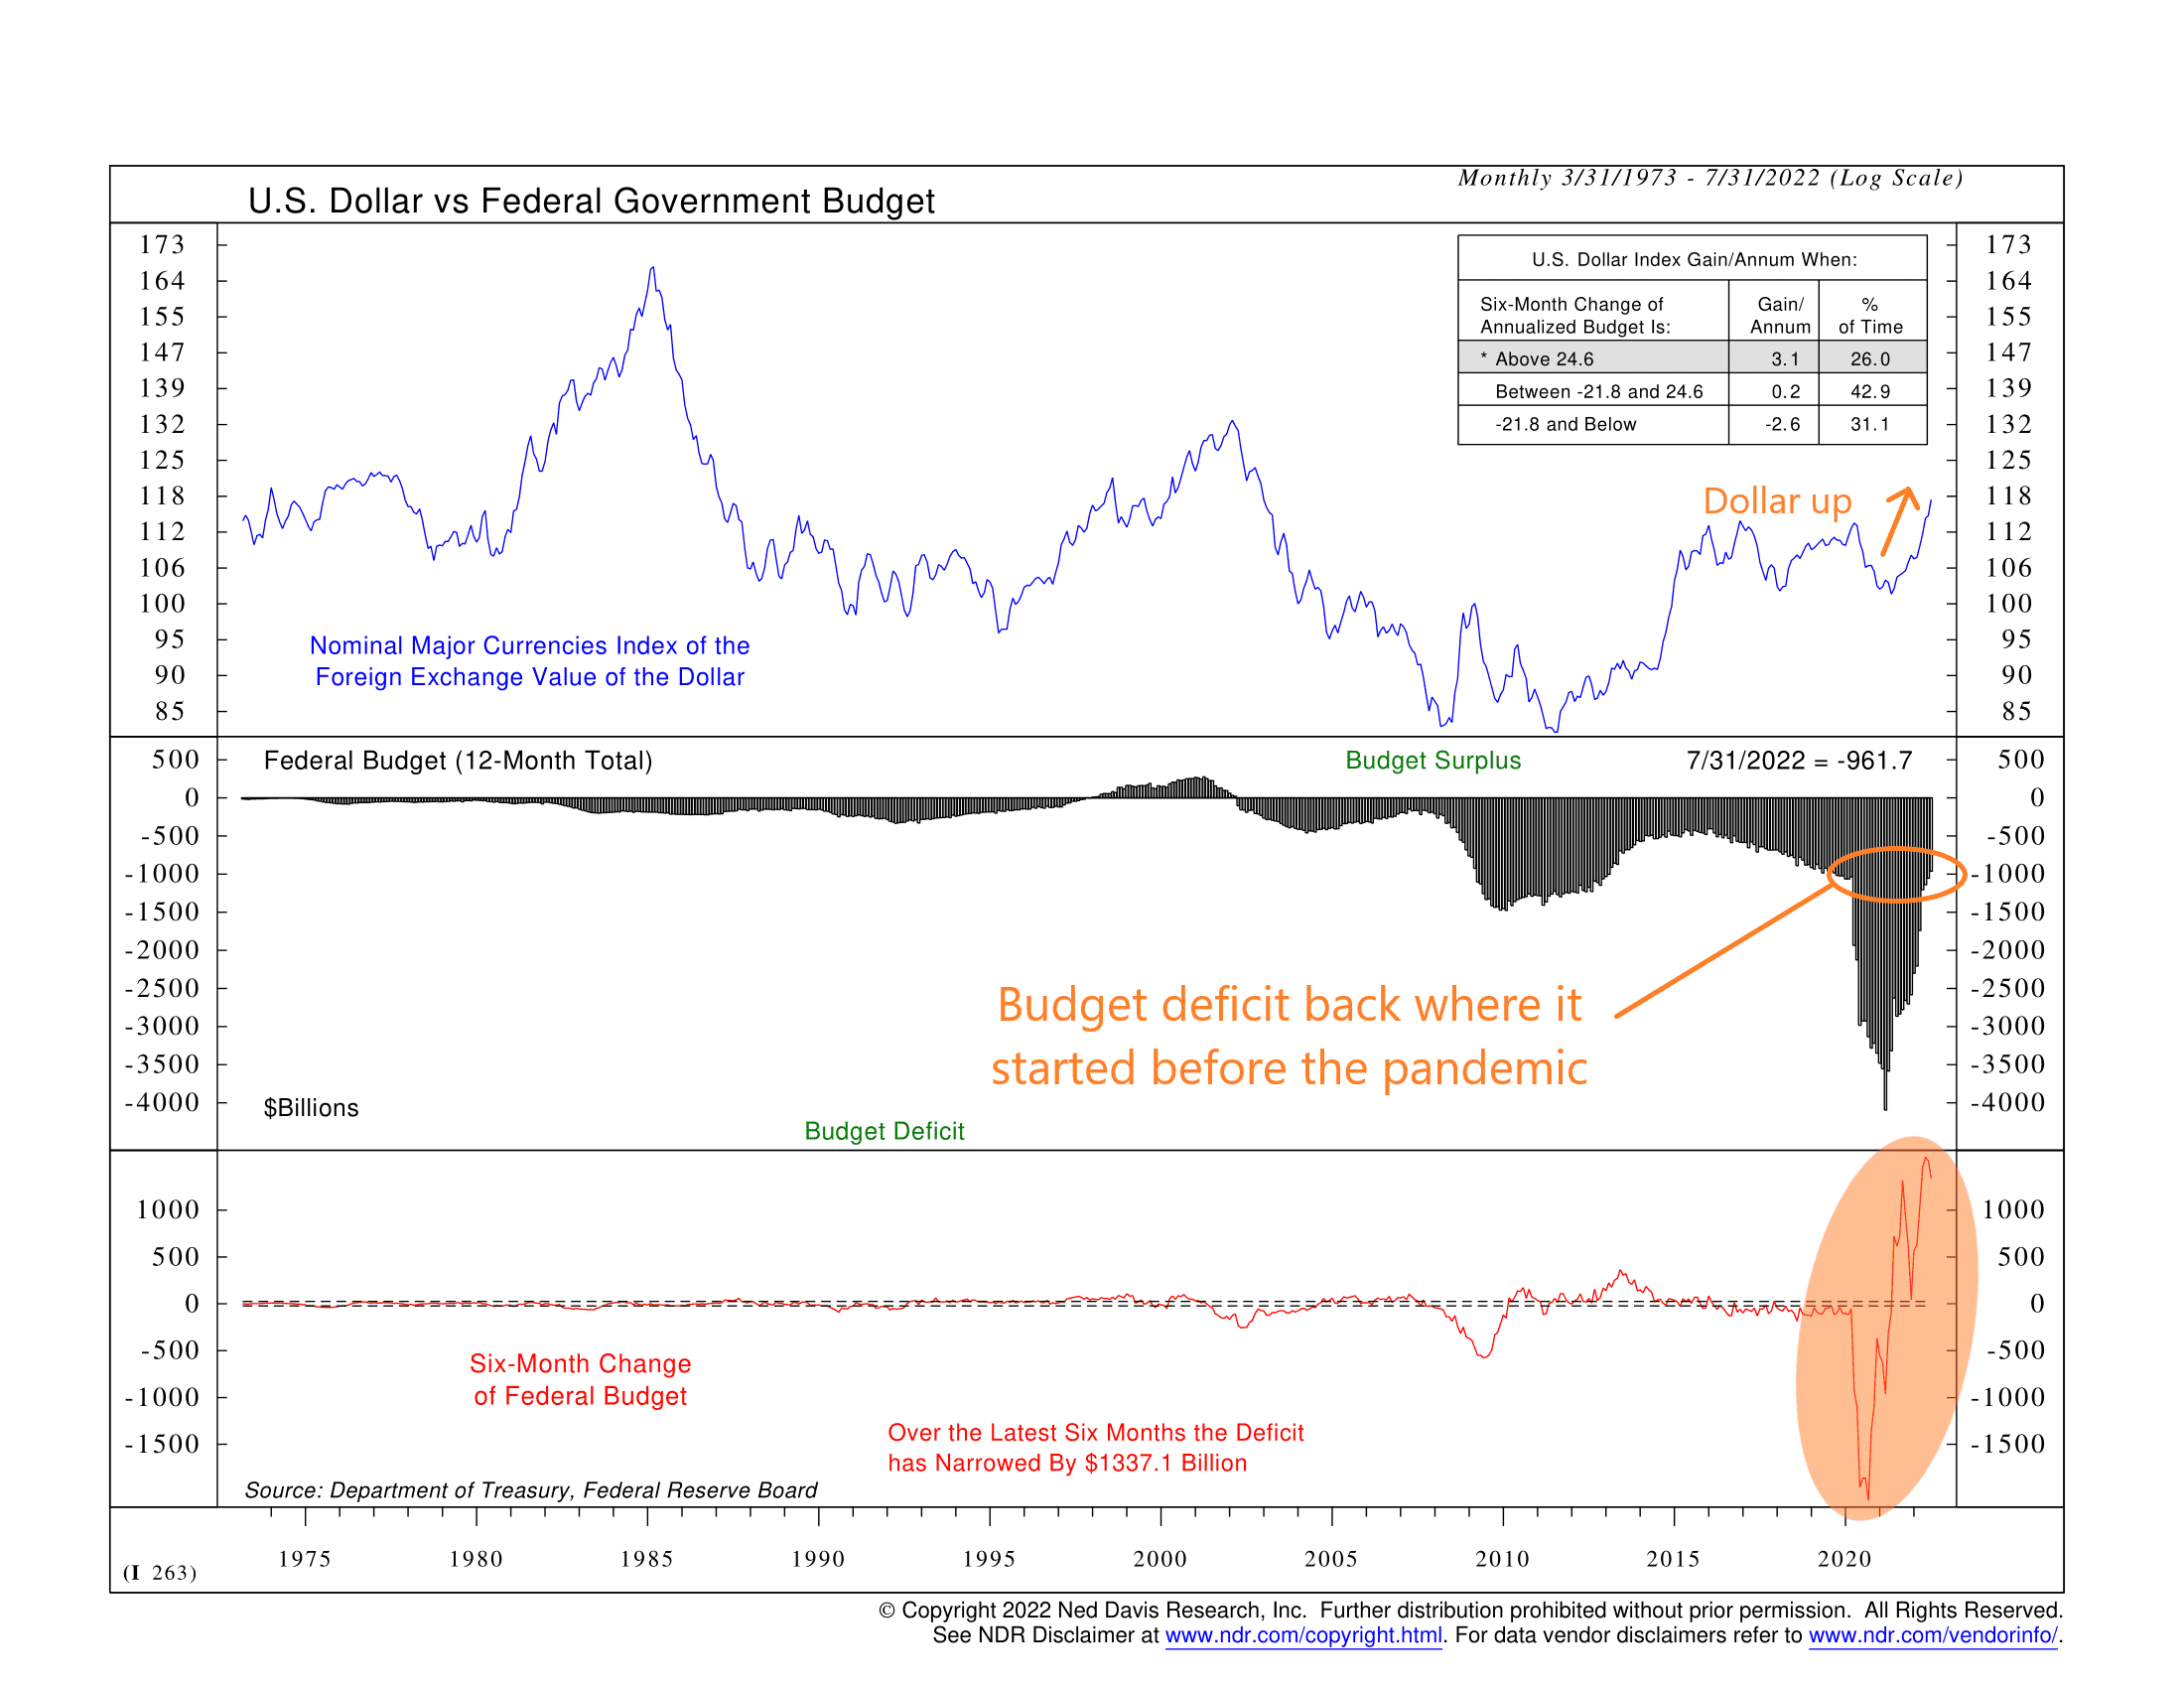
This week’s chart shows the change in the U.S. federal budget going back to 1973. In the middle clip, we have the rolling 12-month total federal budget, with positive values indicating a budget surplus and negative values indicating a budget deficit. The red line in the bottom clip shows the six-month change in the federal budget.
What really stands out is the huge swing in the rate at which the budget grew and then contracted over the past couple of years. You can see the massive dip near 2021 when the government was spending at a record-high rate to the keep the economy afloat during the pandemic. But now, nearly all that spending has reversed, and the budget deficit has narrowed by $1.337 trillion over the past six months alone. The current budget deficit of $961.7 billion is roughly in line with where it was before the pandemic.
An interesting aspect of all this is that, historically, a fast reduction in the budget deficit tends to lead to the U.S. dollar appreciating. The U.S. dollar index is shown as the blue line in the top clip of the chart, and you can see how much it has increased this year alone.
The general theme of all this is belt-tightening. Inflation is running hot, so the Fed is raising rates and tightening up the money supply. The federal government is spending less as well—reducing deficits—and the U.S. dollar is surging. The point of all this is that it should eventually put a lid on inflation, which remains stubbornly high. But the side effect is that this environment is not a kind one for stocks.
This is intended for informational purposes only and should not be used as the primary basis for an investment decision. Consult an advisor for your personal situation.
Indices mentioned are unmanaged, do not incur fees, and cannot be invested into directly.
Past performance does not guarantee future results.