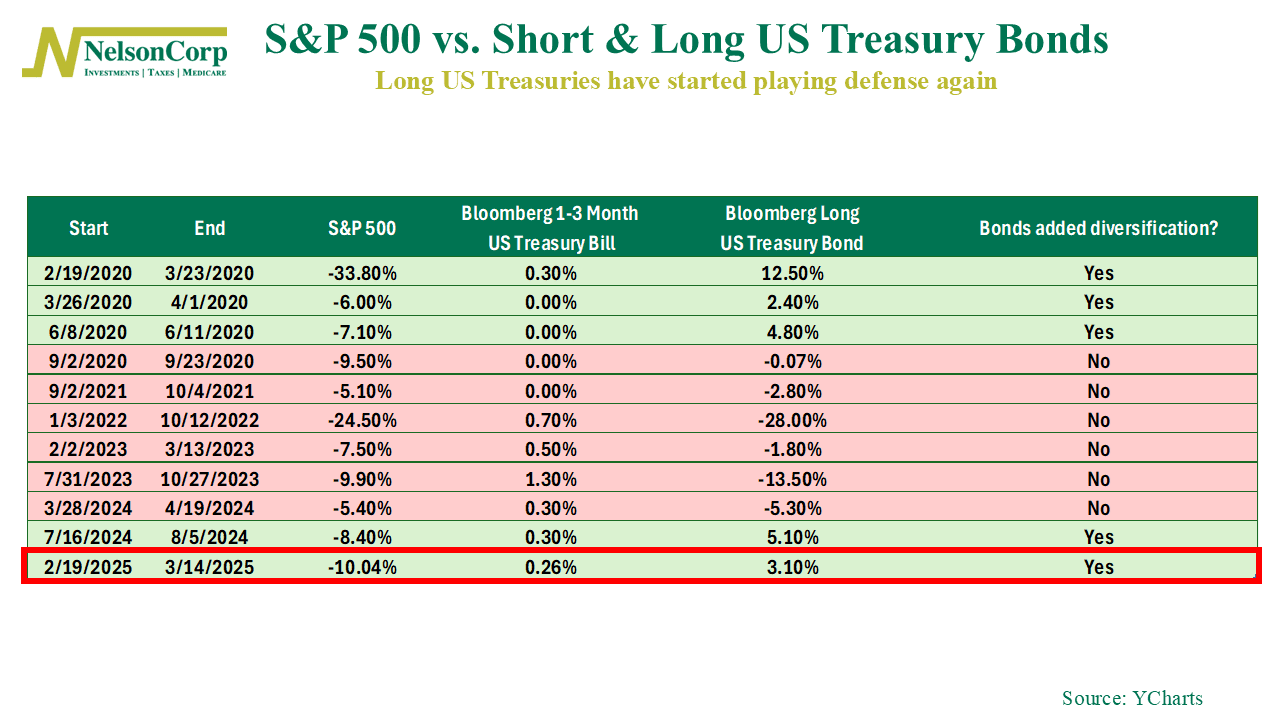
This week’s featured chart is, well… it’s a table.
It tracks how short- and long-duration bonds have performed whenever the S&P 500 stock index has dropped by 5% or more over the past five years. The table highlights whether long-term bonds (Bloomberg Long US Treasury Bond Index) outperformed short-term bonds (Bloomberg 1-3 Month US Treasury Bill Index) during each stock market sell-off.
If long bonds failed to beat short bonds, they provided no real diversification benefit. Those periods appear in red. But when long bonds outperformed—typically by delivering positive returns while short bonds hovered near zero—they successfully played defense, helping cushion losses.
For a few years now, long bonds struggled to offer much protection during stock market downturns. But recently, they’ve performed well, significantly outperforming short-duration bonds during the latest S&P 500 declines. As highlighted in the red box, the most recent market pullback saw long bonds post a solid 3.1% gain, nicely outperforming short bonds.
This is an encouraging sign that the classic stock-bond relationship—where bonds hedge against stock drawdowns—may be making a comeback. Will it last? It’s too soon to say, but it’s definitely a shift worth watching, and maybe even taking advantage of.
This is intended for informational purposes only and should not be used as the primary basis for an investment decision. Consult an advisor for your personal situation.
Indices mentioned are unmanaged, do not incur fees, and cannot be invested into directly.
Past performance does not guarantee future results.
The S&P 500 Index, or Standard & Poor’s 500 Index, is a market-capitalization-weighted index of 500 leading publicly traded companies in the U.S.