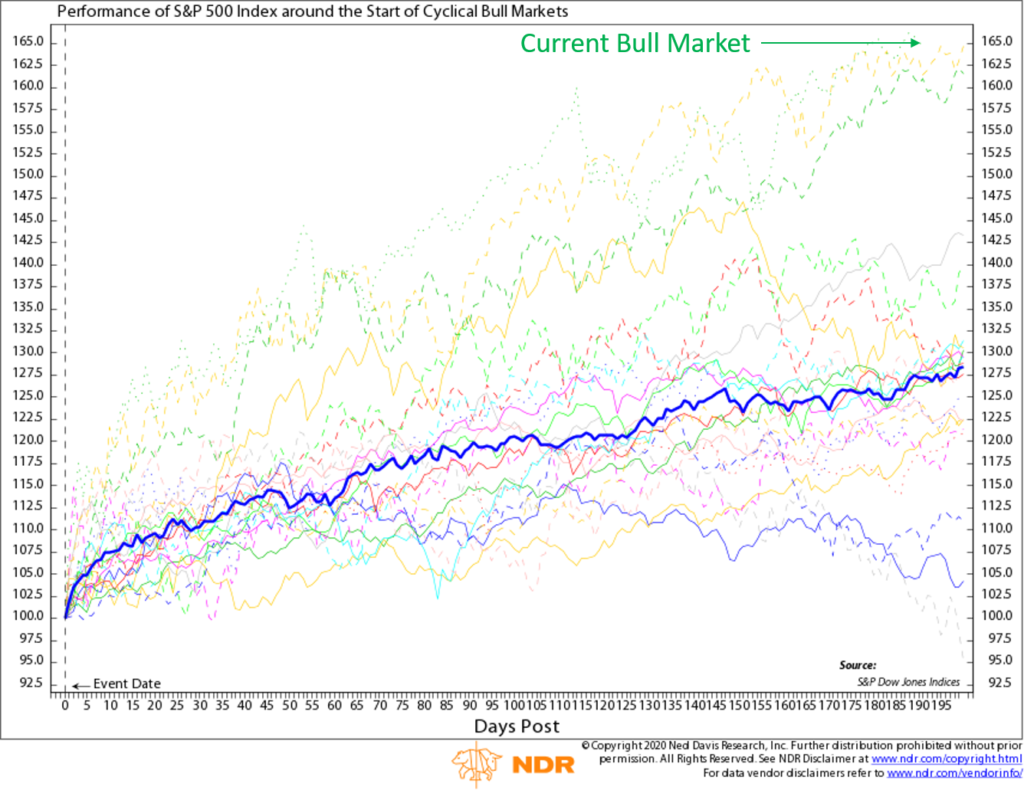
This week’s chart looks at the S&P 500 index’s performance during the first 200 trading days of every cyclical bull market going back to the end of World War II.
The dark blue line shows that the S&P 500 has gained about 28% on average during the first 200 trading days of a new bull market.
That dotted light green line along the top represents the current bull market rally—and what a rally it has been! The S&P 500 has gained roughly 65% since its lows on March 23, 2020.
Although we haven’t quite reached the 200-trading day point yet, the first 190 trading days of this rally has been the strongest on record, just edging out the rallies from the March 2009 and August 1982 lows.
This is intended for informational purposes only and should not be used as the primary basis for an investment decision. Consult an advisor for your personal situation.
Indices mentioned are unmanaged, do not incur fees, and cannot be invested into directly.
Past performance does not guarantee future results.