If you were to ask a random person on the street their thoughts on inflation, they’d likely say, “It’s ridiculously high right now.”
But ask that same question to an economist, and you’d probably get a different answer. They’d say something like, “It’s come down sharply the past couple of years.”
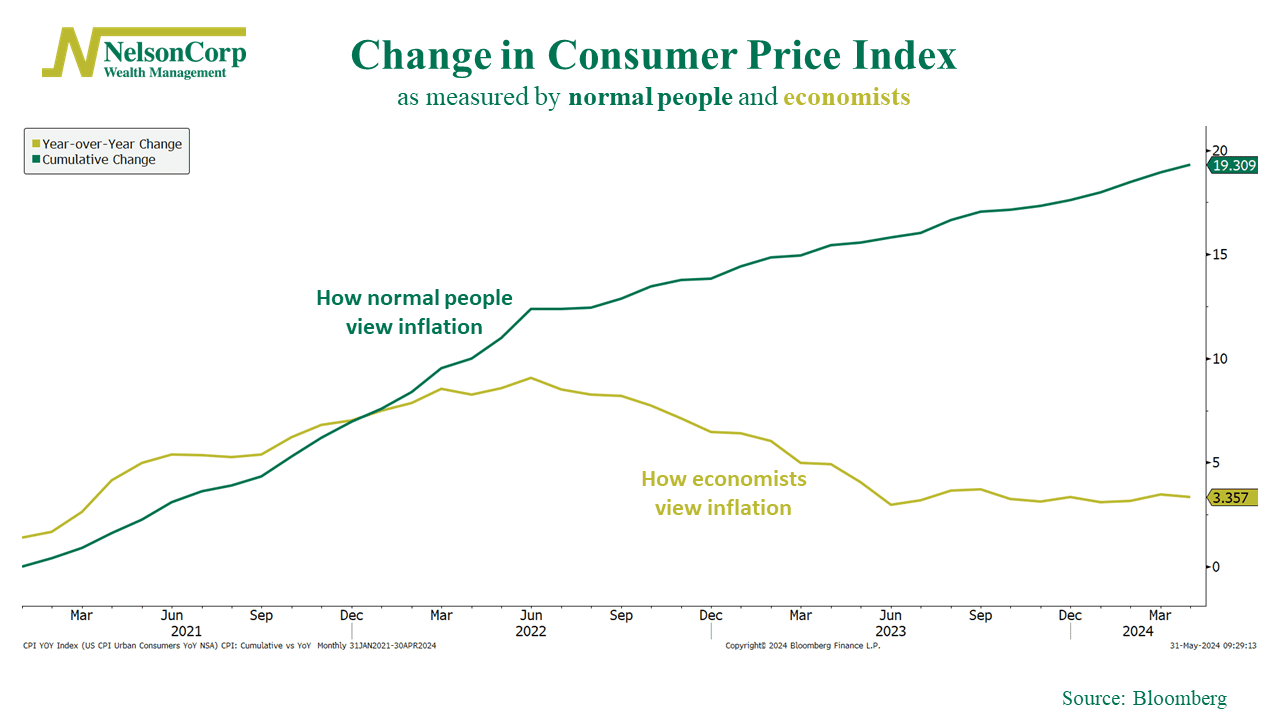
What gives? Well, as this week’s chart shows, it all depends on your perspective—and what we mean when we say “inflation.”
To a normal person, inflation just means higher prices. Am I paying more for stuff today than I was a few years ago? That’s the cumulative change in the Consumer Price Index (CPI), shown as the green line on the chart above. As you can see, it’s up more than 19% since the beginning of 2021.
By contrast, economists tend to focus on the year-over-year change in the CPI. This is the headline number you see in the news. Last month, it came in around 3.4%, much lower than the 9% peak in mid-2022.
So, an economist would say the inflation “rate” has fallen. But to a normal person, that doesn’t mean all that much because price levels are much higher than before—and now prices are just growing more slowly.
The good news for investors is that the stock market is mostly concerned about the year-over-year change in the CPI—the one economists talk about. The stock market will be happy as long as that measure behaves as expected and falls to the Fed’s target.
This is intended for informational purposes only and should not be used as the primary basis for an investment decision. Consult an advisor for your personal situation.
Indices mentioned are unmanaged, do not incur fees, and cannot be invested into directly.
Past performance does not guarantee future results.
