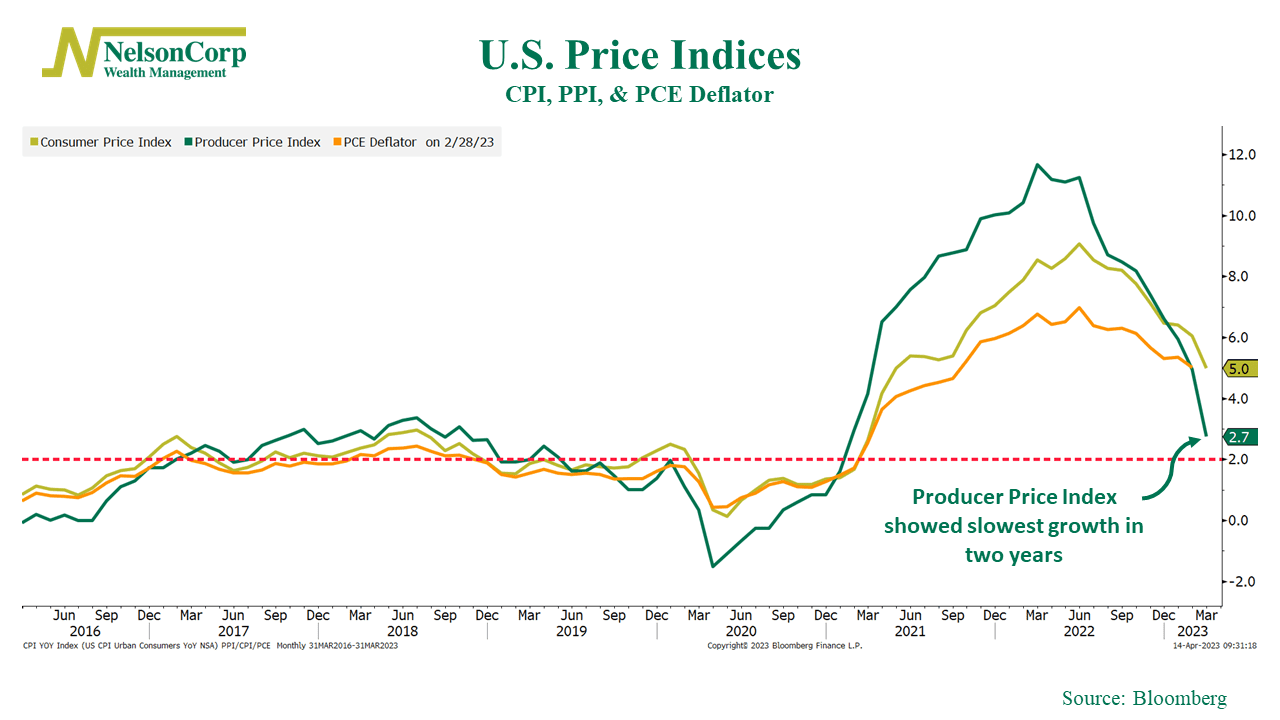
We continue to see encouraging signs that inflation is cooling off in the economy. Our featured chart above illustrates that the U.S. Consumer Price Index (CPI), Producer Price Index (PPI), and PCE Deflator have all exhibited declines in their year-over-year growth rates for multiple months now.
Notably, the PPI, which typically reflects supply conditions in the broader economy, experienced a 0.5% decrease in March compared to the previous month, marking the largest monthly drop since April 2020. Furthermore, the PPI only saw a 2.7% increase from a year ago, signaling a significant slowdown from the higher levels observed in the past year.
This is a noteworthy development as Federal Reserve Chairman Jerome Powell had identified the PPI as an indicator that would impact the Fed’s decision-making on interest rate hikes. The latest data indicating a cooling trend in inflation could strengthen the case for the Fed to pause its ongoing streak of rate increases.
For investors, the key takeaway is that this could be a positive signal for the stock market. Admittedly, the unexpected decline in inflation data was primarily influenced by falling energy prices, which could turn out to be temporary. But nevertheless, the overall trend depicted in our chart suggests that the data are definitely moving in the right direction.
This is intended for informational purposes only and should not be used as the primary basis for an investment decision. Consult an advisor for your personal situation.
Indices mentioned are unmanaged, do not incur fees, and cannot be invested into directly.
Past performance does not guarantee future results.
