The market’s off to a bumpy start this year, but beneath the surface, there have been some clear winners and losers.
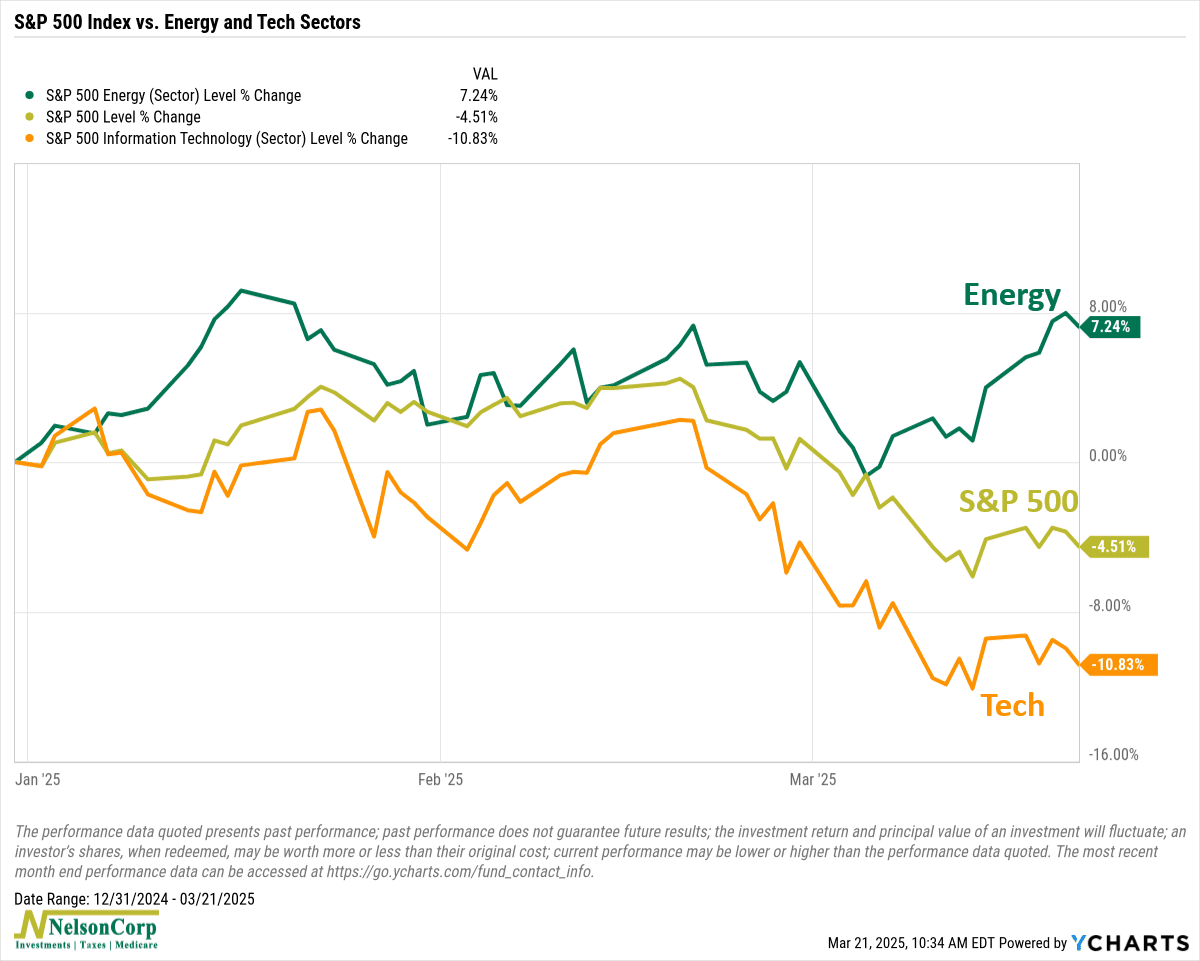
Just take a look at this week’s chart. It’s been a story of gushers for energy and glitches for tech so far. Energy stocks, as represented by the S&P 500 Energy Sector Index, are up a whopping 7% this year. Meanwhile, the broader S&P 500 is down around 4.5%, and the once high-flying tech sector has tumbled over 10%.
That’s a big shift from what we’ve seen in recent years. What’s going on? Inflation concerns and geopolitical uncertainty have certainly helped fuel oil’s rise. Meanwhile, shifting investor sentiment and economic uncertainty have put significant pressure on technology stocks.
This kind of rotation is a great reminder of why it pays to be flexible. Markets move in cycles, and sectors that lead one year can lag the next. Having the ability to make tactical shifts when conditions change can make all the difference in navigating uncertain markets.
This is intended for informational purposes only and should not be used as the primary basis for an investment decision. Consult an advisor for your personal situation.
Indices mentioned are unmanaged, do not incur fees, and cannot be invested into directly.
Past performance does not guarantee future results.
The S&P 500 Index, or Standard & Poor’s 500 Index, is a market-capitalization-weighted index of 500 leading publicly traded companies in the U.S.