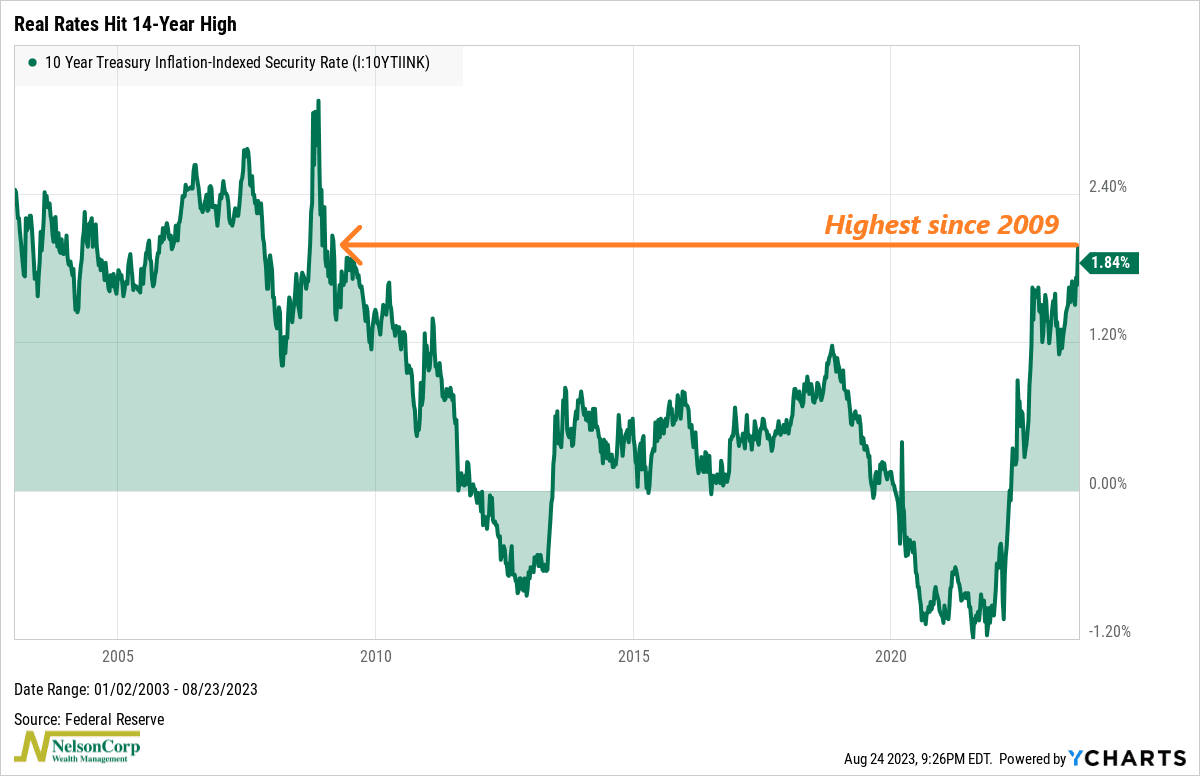
This week’s chart shows the yield on 10-year TIPS—Treasury Inflation-Protected Securities—or what is more commonly known as “real yields.” Real, in this sense, means the rate is adjusted for inflation, so it tells us whether the interest rates on government bonds are beating inflation or not.
For most of the post-2008 era, real rates were either negative or barely above zero. While bad for bondholders, this was a pretty good deal for stocks, as lower real rates had a stimulative effect on stock price-to-earnings multiples—or valuations.
However, starting last year and continuing this year, real rates have zoomed higher into positive territory on the back of the Fed jacking up rates. On Monday, as you can see on the chart, the real 10-year rate hit 2%, its highest level since 2009!
This could be a problem for the stock market because it means price-to-earnings multiples could take a hit. In lay terms, this means investors might not be so willing to pay up for stocks if government bonds are actually paying a decent return over and above the inflation rate. This doesn’t mean positive real rates will be a disaster for the stock market—but they could be a headwind.
This is intended for informational purposes only and should not be used as the primary basis for an investment decision. Consult an advisor for your personal situation.
Indices mentioned are unmanaged, do not incur fees, and cannot be invested into directly.
Past performance does not guarantee future results.
