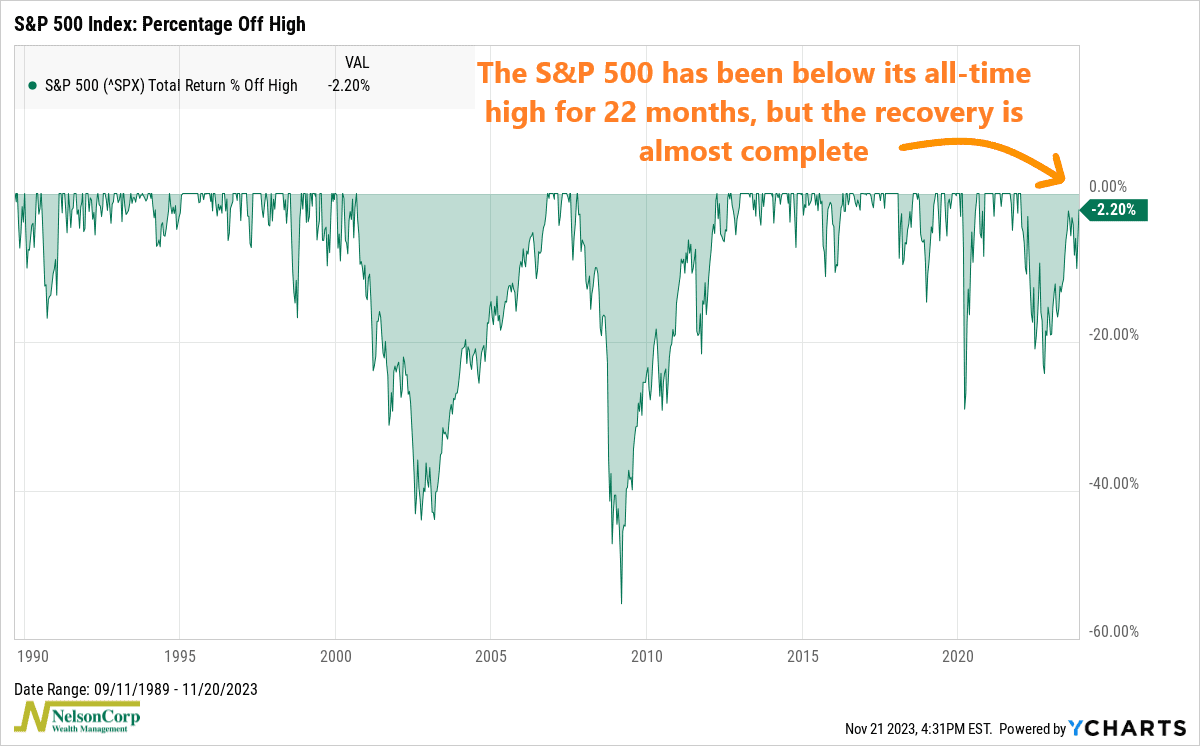
This week’s chart is called a percentage drawdown or percentage off high chart. It’s a visual representation of the decline in the value of the stock market from its peak to its lowest point, expressed as a percentage.
For example, the last time the S&P 500 Index traded at its all-time high (on a total return basis) was January 3, 2022. As you can see on the far right-hand side of the chart, the index then fell nearly 25% by October 2022, its lowest point reached in this drawdown cycle. However, it has since rebounded and now sits just 2.2% below its all-time high.
All this has taken roughly 470 trading days—or 22 months. This happens to be the third longest amount of time the S&P 500 has spent below a high in the past 50 years. Only the 2000-2006 (Dot-Com Bust) and the 2007-2012 (Great Financial Crisis) periods were longer. Each of those lasted well over 1,000 trading days.
The good news, though, is that after briefly falling back into correction territory (10%+ below its high) early this month, the S&P 500 has rebounded very strongly and is within spitting distance of that January 2022 high. We’re not there yet. But given the favorable technical backdrop and strong year-end seasonality, new record highs are likely not far off for the U.S. stock market.
This is intended for informational purposes only and should not be used as the primary basis for an investment decision. Consult an advisor for your personal situation.
Indices mentioned are unmanaged, do not incur fees, and cannot be invested into directly.
Past performance does not guarantee future results.
The S&P 500 Index, or Standard & Poor’s 500 Index, is a market-capitalization-weighted index of 500 leading publicly traded companies in the U.S.
