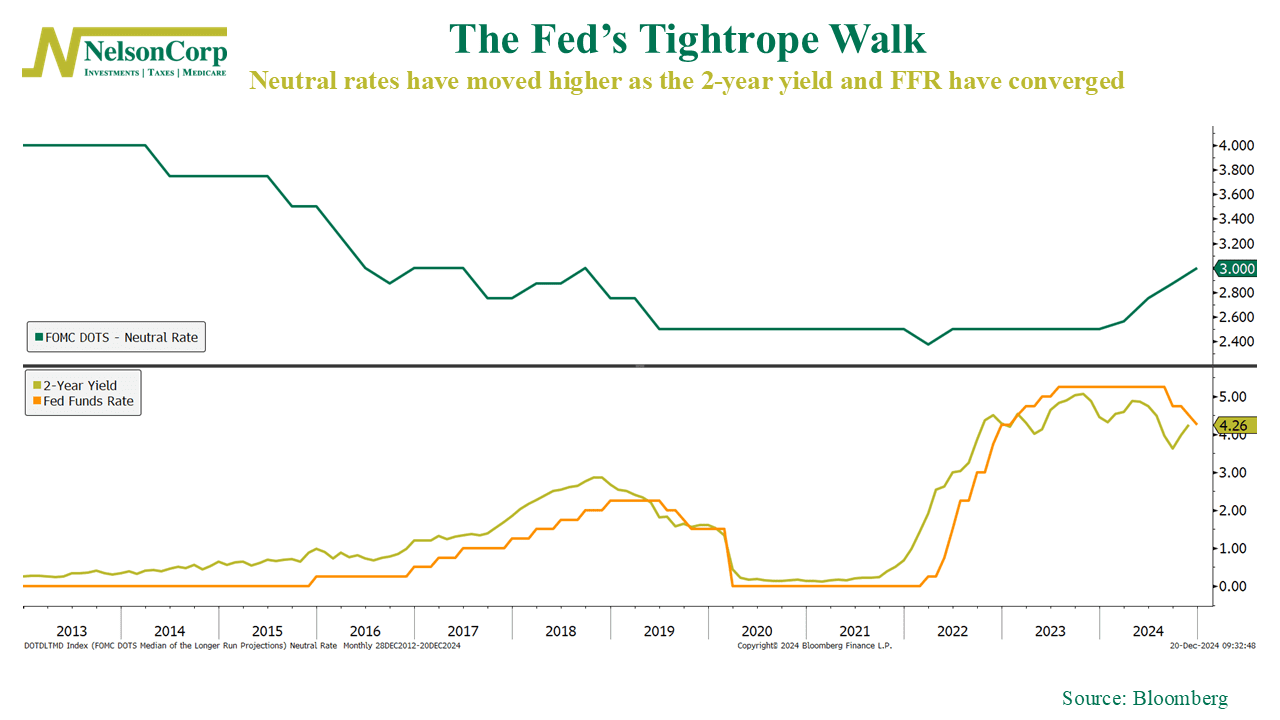
The Federal Reserve shook up financial markets this week, with stocks sliding after yet another rate cut. But it wasn’t the cut itself that rattled investors—it was the Fed’s revised projection for the “neutral rate,” shown in green on the chart.
This neutral rate climbed to 3%, its highest level since September 2018. Why does that matter? The neutral rate is like the Goldilocks setting for interest rates—not too high to slow the economy, but not too low to fuel inflation. A higher neutral rate suggests that rates might need to stay elevated longer than previously expected.
Now, look at the orange and yellow lines at the bottom of the chart: the 2-year Treasury yield and Fed Funds Rate have converged. This is the bond market signaling, “Enough with the rate cuts—it’s time to slow down.”
The takeaway? The market wants the Fed to ease up on rate cuts, while the Fed is coming to terms with the reality that rates need to stay higher for longer. Combine these signals, and you’ve got the perfect storm for a stock market selloff.
This is intended for informational purposes only and should not be used as the primary basis for an investment decision. Consult an advisor for your personal situation.
Indices mentioned are unmanaged, do not incur fees, and cannot be invested into directly.
Past performance does not guarantee future results.