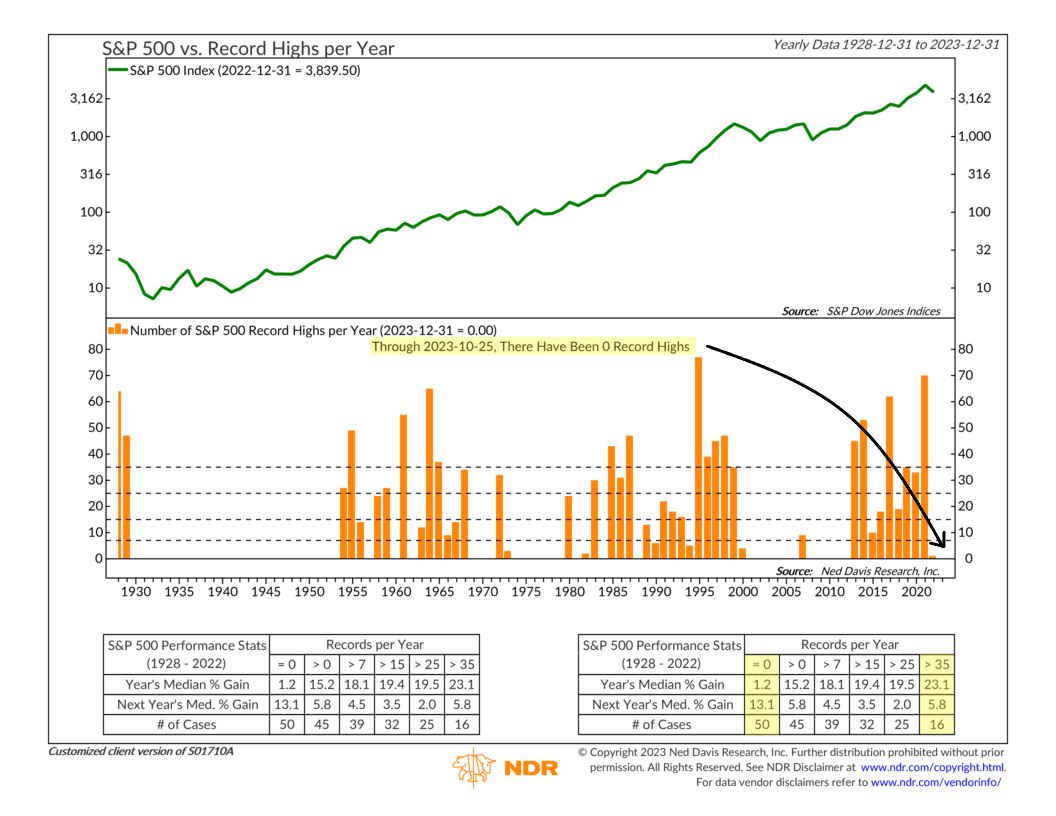
It’s been a while since the S&P 500 stock index made a record high. As our featured chart this week shows, there have been zero record highs this year; in fact, it’s been 21 months since the stock market last reached a record high, the longest streak in a decade.
But here’s the good news. According to the data table on the chart above, years with zero record highs have historically seen a median gain of 13.1% the following year. By comparison, in years in which there have been 35+ record highs, the next year’s median gain was just 5.8%.
To be sure, the stock market could still go on to reach a record high before the year is over; there are still about nine weeks of trading left. However, as of this writing, the S&P 500 is still more than 13% away from its all-time high, so if stocks are going to rally, they need to do it soon.
Nonetheless, the key lesson to draw from this week’s chart is that even if we have to experience some temporary pain in the stock market today, it could lay the foundation for potential rewards tomorrow.
This is intended for informational purposes only and should not be used as the primary basis for an investment decision. Consult an advisor for your personal situation.
Indices mentioned are unmanaged, do not incur fees, and cannot be invested into directly.
Past performance does not guarantee future results.
The S&P 500 Index, or Standard & Poor’s 500 Index, is a market-capitalization-weighted index of 500 leading publicly traded companies in the U.S.
