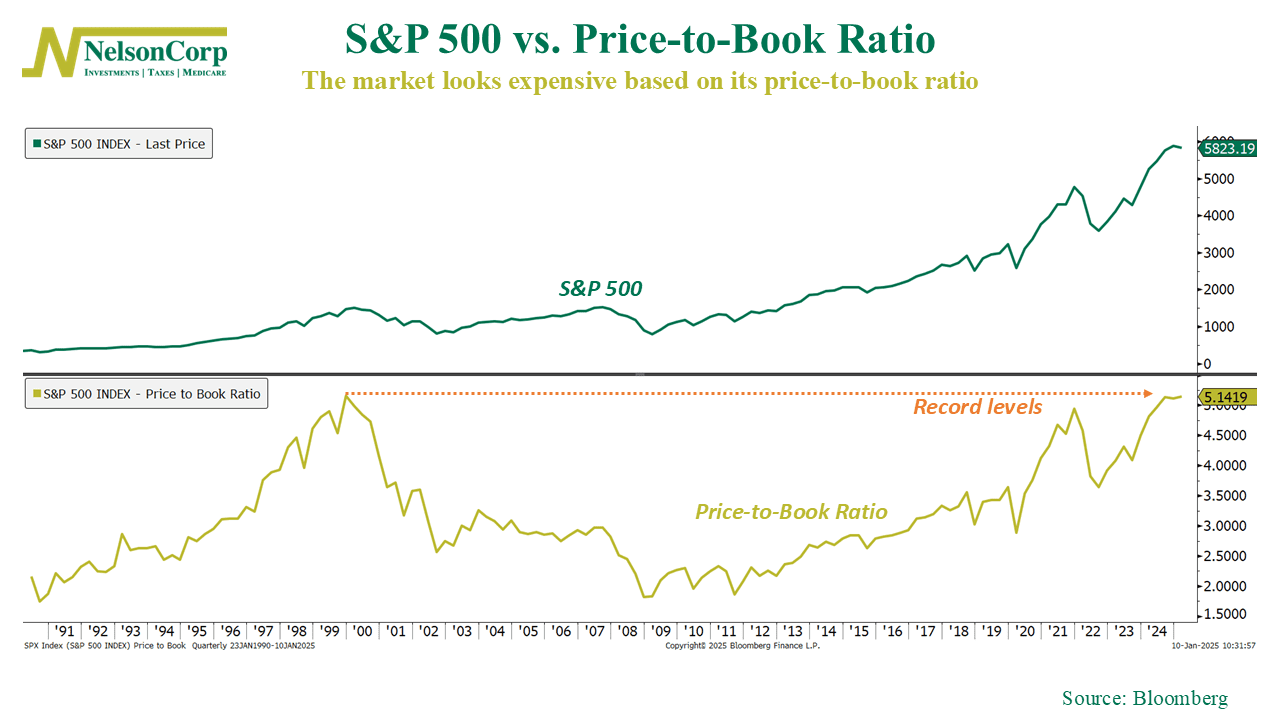
The stock market is starting to look expensive.
As our chart this week highlights, the S&P 500’s price-to-book (P/B) ratio just hit 5.14—record territory. Historically, the P/B ratio, which compares the market’s value of companies to their book value (or net worth), has been a reliable indicator of stock market valuations. High P/B levels signal that investors are paying a premium for each dollar of company assets, often translating to lower future returns.
Take the late 1990s tech bubble, for example. P/B ratios surged, and investors chasing the market’s excitement were later met with lackluster returns as reality set in. Today’s levels resemble those frothy times.
What does this mean? History suggests that when markets get this expensive, it pays to proceed with caution. Elevated valuations often precede periods of slower growth or even declines. While it doesn’t predict immediate downturns, it’s a signal to manage expectations and stay focused on the long-term.
This is intended for informational purposes only and should not be used as the primary basis for an investment decision. Consult an advisor for your personal situation.
Indices mentioned are unmanaged, do not incur fees, and cannot be invested into directly.
Past performance does not guarantee future results.
The S&P 500 Index, or Standard & Poor’s 500 Index, is a market-capitalization-weighted index of 500 leading publicly traded companies in the U.S.
