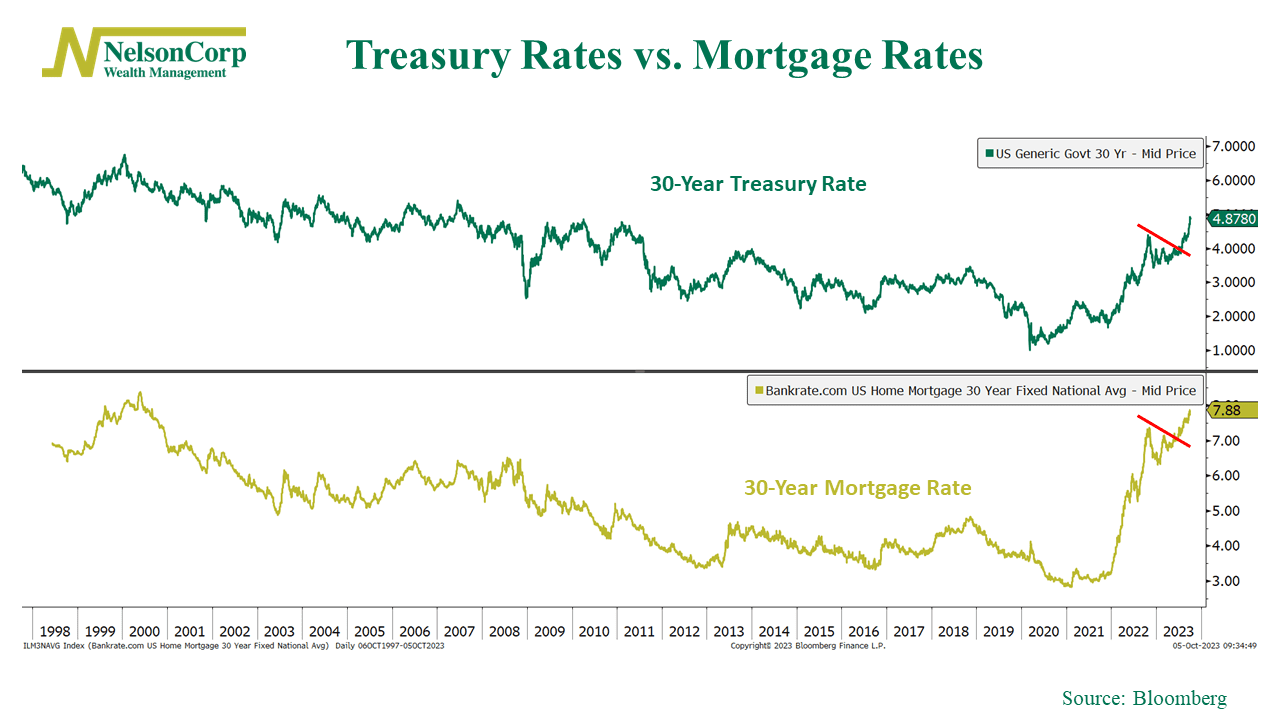
For a while, it looked as if long-term interest rates had peaked. The 30-year Treasury rate was falling, and mortgage rates were down a whole percentage point from their November 2022 highs.
But things have since changed. As our featured chart above shows, both rates have broken out of their recent downtrends with a vengeance. The 30-year Treasury rate—the rate the U.S. government borrows for 30 years—has risen to 4.87%, its highest level since 2007. Meanwhile, the 30-year mortgage rate has made an even stronger comeback, rising to 7.88%, the highest it’s been since 2000.
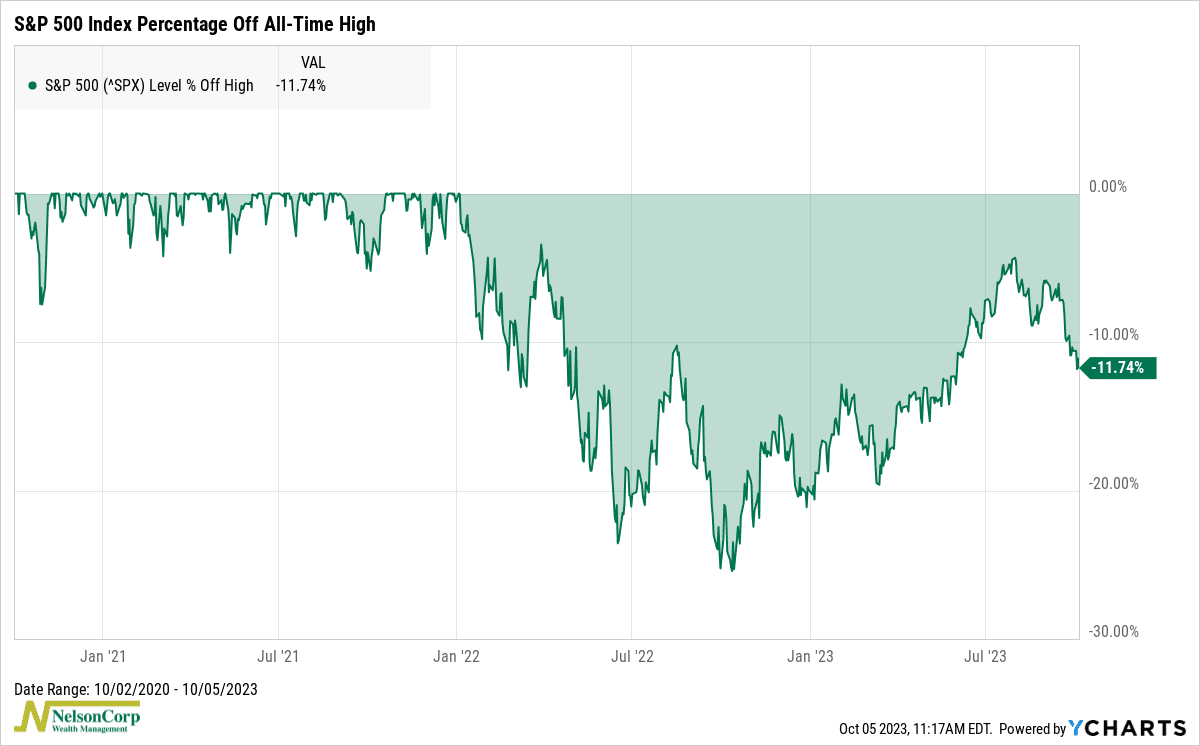
This reversal in long-term rates doesn’t just impact individuals buying homes and governments seeking to borrow funds; it affects the stock market, too. In fact, it has left the stock market in a downright grumpy mood. As depicted in our bonus chart below, at one point this summer, the S&P 500 Index, which tracks the 500 largest U.S. stocks, was approaching just -5% below its all-time peak. However, following the reversal in long-term interest rates, the stock market’s drawdown is now back to nearly -12%.

The bottom line? We’ve witnessed significant fluctuations in interest rates this year, leading to recent turbulence in the stock market. While financial markets are continually evolving, this specific episode underscores the importance of adaptability, vigilance, and, as a timeless principle, a thorough understanding of your investments.
This is intended for informational purposes only and should not be used as the primary basis for an investment decision. Consult an advisor for your personal situation.
Indices mentioned are unmanaged, do not incur fees, and cannot be invested into directly.
Past performance does not guarantee future results.
The S&P 500 Index, or Standard & Poor’s 500 Index, is a market-capitalization-weighted index of 500 leading publicly traded companies in the U.S.
