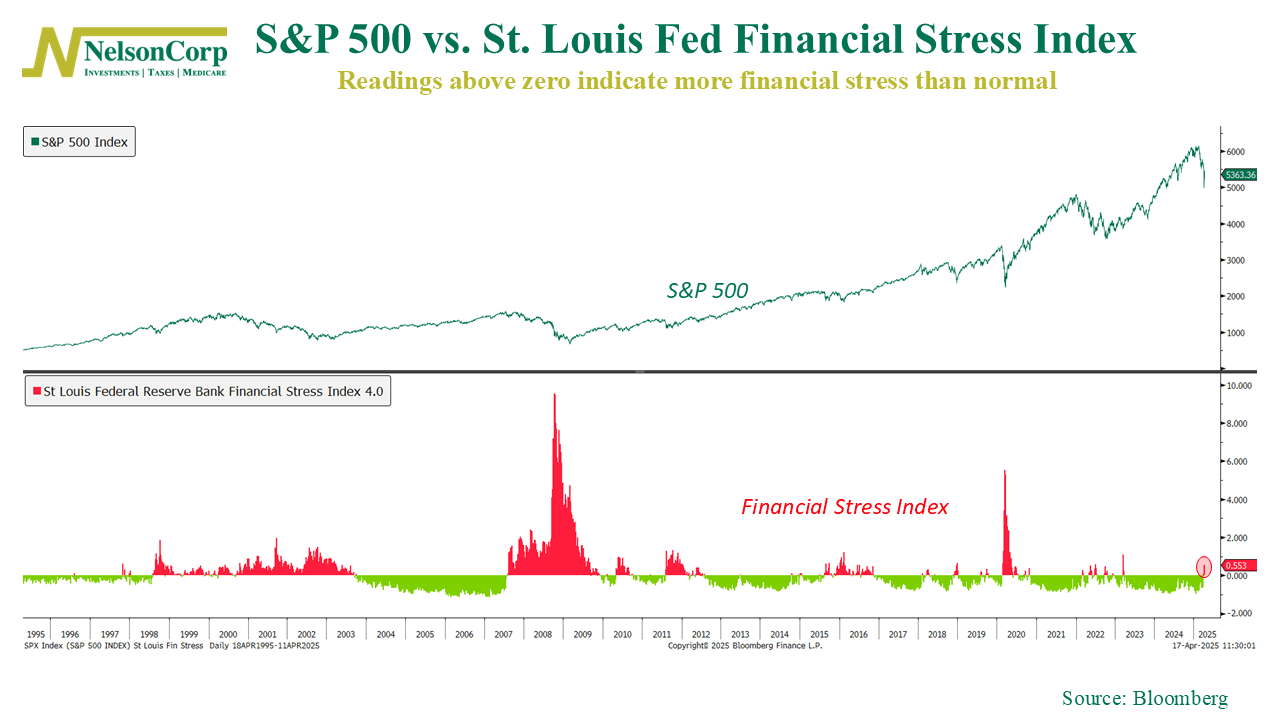
After more than two years of calm, financial stress is creeping back into the market.
The chart above shows the St. Louis Fed Financial Stress Index (bottom panel) plotted against the S&P 500 (top panel). The index tracks 18 different weekly data points—things like yield spreads, volatility measures, and credit indicators—to capture overall financial market strain. When the index is below zero, it suggests stress levels are lower than average. When it rises above zero, things are getting tighter.
This past week, the stress index jumped into positive territory for the first time in 105 weeks. It’s now reading 0.553 as of April 11th—the highest level in nearly two years. While that’s nowhere near crisis levels, it’s a notable shift. Historically, upticks like this have come alongside rising uncertainty, tighter credit conditions, and volatility in markets.
You can see in the chart how financial stress tends to spike during major events: the dot-com bust, the Global Financial Crisis, the COVID shock. But it also shows more subtle warning signs—like in late 2018 and early 2020—where stress quietly built up before making a more obvious impact on asset prices.
It’s too early to say whether this recent jump marks the start of a larger trend. But it’s definitely a change in character. And with markets no longer sitting at their highs, a rising stress index is another reason for investors to stay cautious.
This is intended for informational purposes only and should not be used as the primary basis for an investment decision. Consult an advisor for your personal situation.
Indices mentioned are unmanaged, do not incur fees, and cannot be invested into directly.
Past performance does not guarantee future results.
The S&P 500 Index, or Standard & Poor’s 500 Index, is a market-capitalization-weighted index of 500 leading publicly traded companies in the U.S.