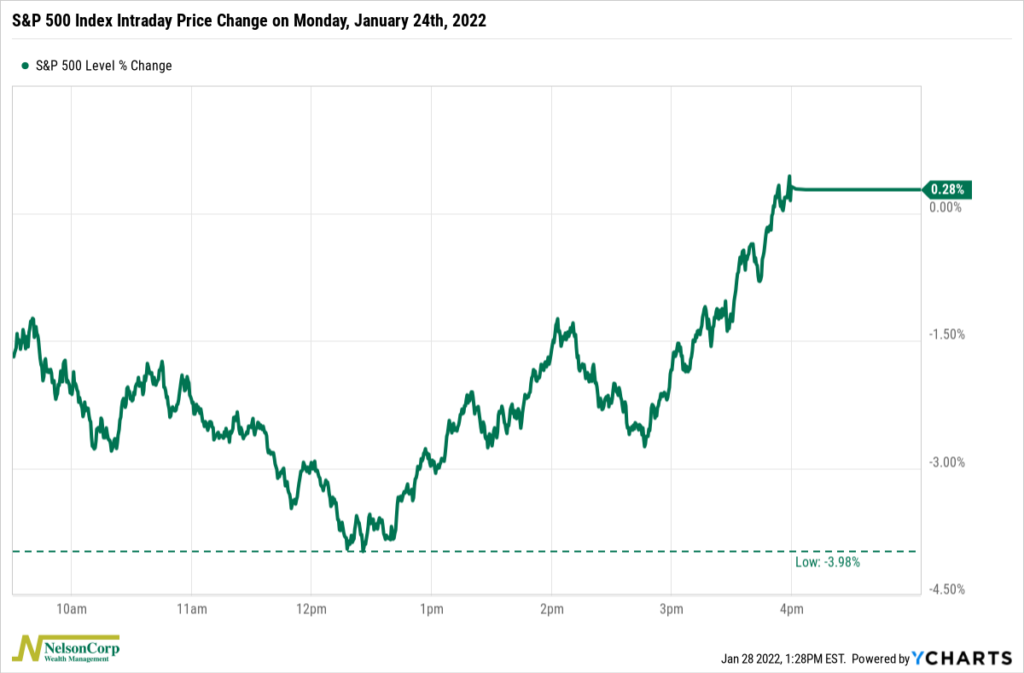
This past Monday, the S&P 500 index gained 0.28%. That seemed like a pretty normal day—nothing to write home about there. However, like a duck frantically kicking its legs under the surface of the pond, the S&P 500 had to stage quite the comeback throughout the trading day to stay afloat.
Our featured chart above shows the intraday price change of the S&P 500 on Monday, January 24, 2022. When the U.S. stock market opened, stocks immediately traded lower by about 1.5%. It looked like it was going to be a rough day on Wall Street, and sure enough, by about 12:30 pm, the S&P 500 had fallen to the low of the day of nearly 4% down. Ouch!
But then it all reversed. By 2 pm, the index was back to where it started the day, down 1.5%. It fell again over the next hour. But then, around 3 pm, the S&P 500 staged a tremendous comeback rally that led to the index ending in slightly positive territory for the day. Only three other times in history has the market been down more in percent terms and finished positive by the day’s close.
This was the most extreme example, but this type of intraday volatility has been a feature of the market recently. Volatility usually rises when the market sells off, so that’s nothing new. But we haven’t seen this type of intraday volatility since the March 2020 selloff, and after a year like last year—when the S&P 500 never fell more than 5% off its high—it’s pretty shocking at times to see these types of big swings again.
This is intended for informational purposes only and should not be used as the primary basis for an investment decision. Consult an advisor for your personal situation.
Indices mentioned are unmanaged, do not incur fees, and cannot be invested into directly.
Past performance does not guarantee future results.