It was a wild week for financial markets, with tariff announcements and major policy shifts in Europe keeping investors on edge. These developments fueled significant volatility in stocks. The S&P 500—Wall Street’s go-to benchmark—swung more than 1% in either direction for six straight days, marking its longest such streak since November 2020.
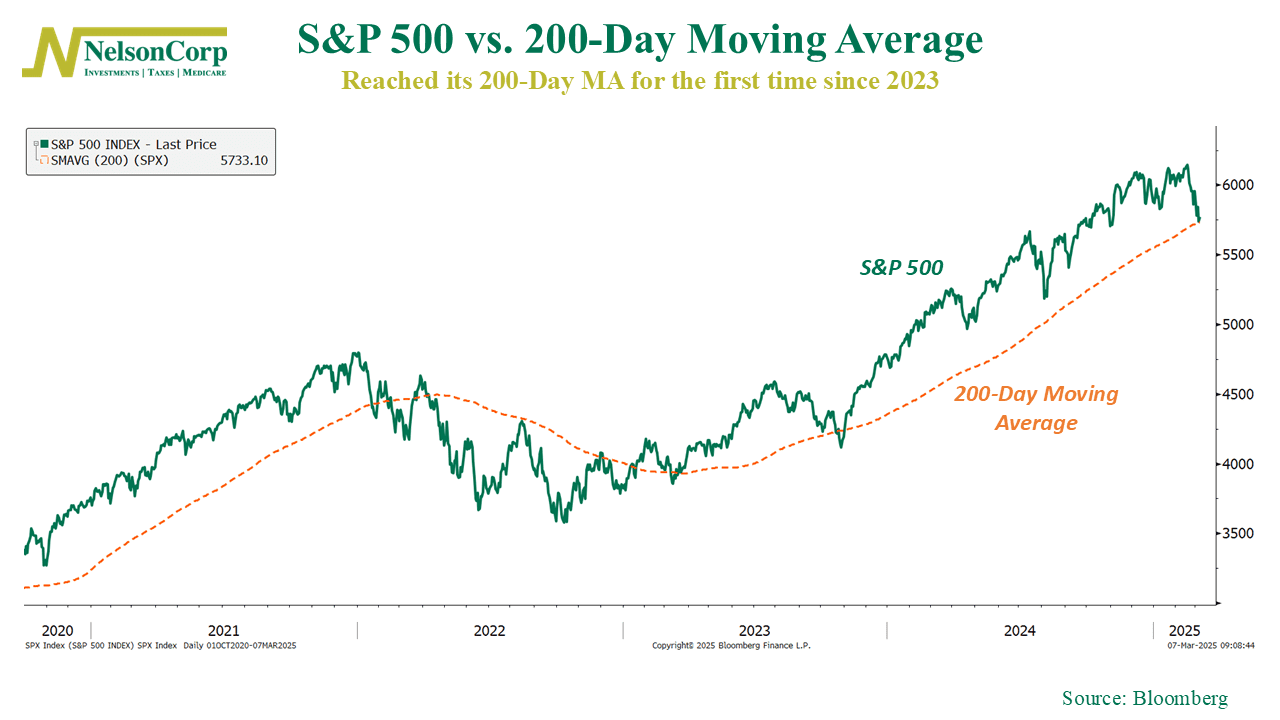
Where does that leave us? As our chart this week highlights, the S&P 500 has now dropped to its 200-day moving average, a key technical level traders use to gauge the market’s long-term trend. This marks the first time it has tested this support since late 2023.
Does this signal trouble for the broader stock market? Possibly. The last time the index fell below its 200-day moving average in 2023, it quickly rebounded. However, in 2022, repeated breaks below this level triggered a sustained downtrend, as the moving average itself rolled over and trended downward.
So basically, the 200-day moving average often serves as a critical support level—if buyers step in quickly. But the longer the market struggles at this level, the greater the chances of a deeper correction. Bottom line? This will be a crucial indicator to watch in the coming weeks.
This is intended for informational purposes only and should not be used as the primary basis for an investment decision. Consult an advisor for your personal situation.
Indices mentioned are unmanaged, do not incur fees, and cannot be invested into directly.
Past performance does not guarantee future results.
The S&P 500 Index, or Standard & Poor’s 500 Index, is a market-capitalization-weighted index of 500 leading publicly traded companies in the U.S.