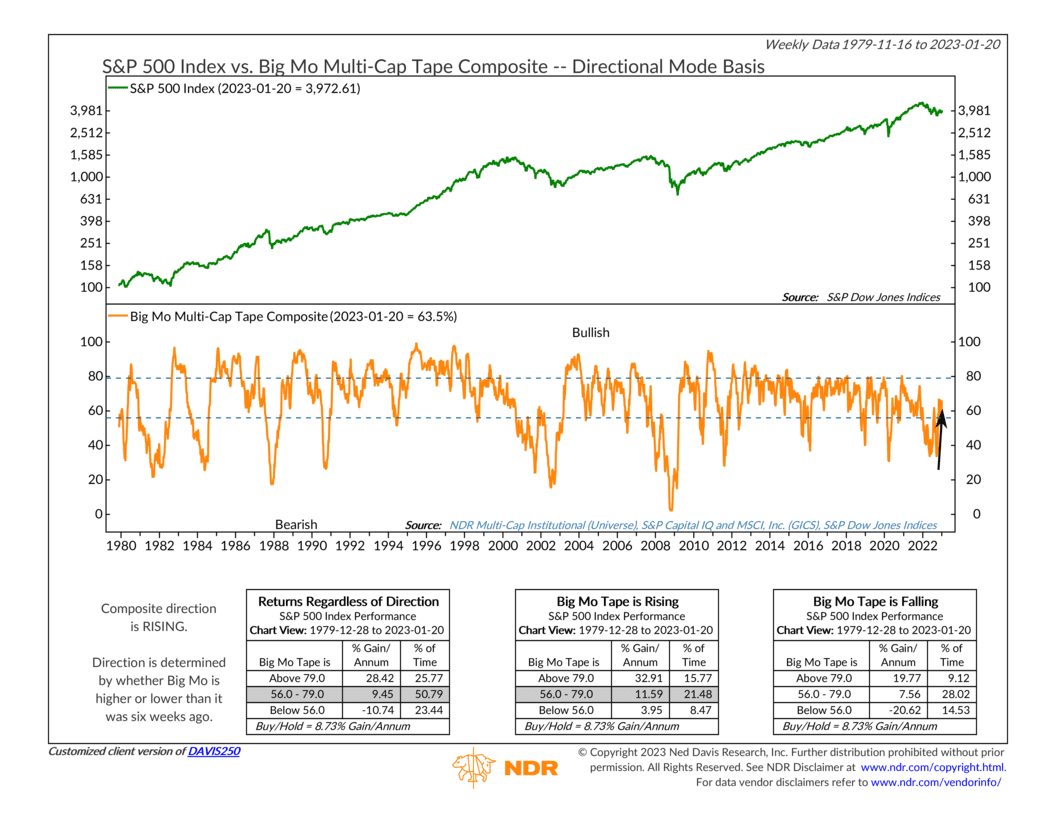
Big Mo, or “Big Momentum,” is an indicator we use to measure the trend and momentum of the stock market. It’s one of the best tools around for measuring the technical health of the broader equity market.
It does this by combining over 100 component indicators into what is called a “diffusion index,” with readings that range between 0% and 100%. The reading reflects the percentage of bullish individual trend and momentum indicators taken from the various subindustries comprising the 11 sectors of the S&P 500.
Some subindustries get a trend indicator, representing the direction of the moving average of the subindustries’ price index. And others get a momentum indicator based on the rate of change of the subindustries’ price index. Overall, Big Mo has about 2 momentum indicators for every 1 trend indicator.
Direction is an important feature of the indicator. The direction of Big Mo is determined by whether its current reading is higher or lower than it was 6 weeks ago. Historically, high and rising readings for Big Mo—shown as the orange line on the bottom clip of the chart—have tended to coincide with the best returns for the S&P 500 Index, whereas low and falling readings have been the worst.
Specifically, we consider readings above 56 when Big Mo is rising as positive. If it’s falling, but above a reading of 79, that’s also positive. If Big Mo is below 56 but rising or between the brackets and falling, that’s considered neutral. And a Big Mo reading that is falling and below 56 gets the only negative reading.
For example, we recently got a positive signal. Big Mo is in the neutral zone with a reading of 63.5%, and it is rising relative to where it was 6 weeks ago. Historically, the S&P 500 Index has grown at an annualized pace of over 11% per year when this is the case. In other words, momentum has really picked up in the stock market in recent weeks.
So, the bottom line is that Big Mo is an excellent tool for measuring the technical health of the market. It’s useful because it measures momentum, a term typically used to describe physical objects. But stock prices tend to exhibit characteristics like those of objects in motion, so measuring momentum is a valuable exercise. And ultimately, Big Mo helps us achieve our goal of staying on the right side of the price action.
This is intended for informational purposes only and should not be used as the primary basis for an investment decision. Consult an advisor for your personal situation.
Indices mentioned are unmanaged, do not incur fees, and cannot be invested into directly.
Past performance does not guarantee future results.
