One of the cool things about interest rates is they act as a barometer for the economy. When rates are going higher, it’s generally a sign that the economy is strong. But when rates are falling, it’s typically because the economy is weak.
Many things affect interest rates, but in major developed countries, short-term rates are targeted and effectively set by the central bank. Setting short-term interest rates is the primary tool central banks use to conduct monetary policy. And the goal of monetary policy is to achieve price stability and help manage economic fluctuations.
To respond to changing economic conditions, central banks implement a series of smaller interest rate changes, which can span months or sometimes even years. These series of rate increases or reductions are known as tightening or easing cycles. During a tightening cycle, the central bank raises rates, and during an easing cycle, it lowers them.
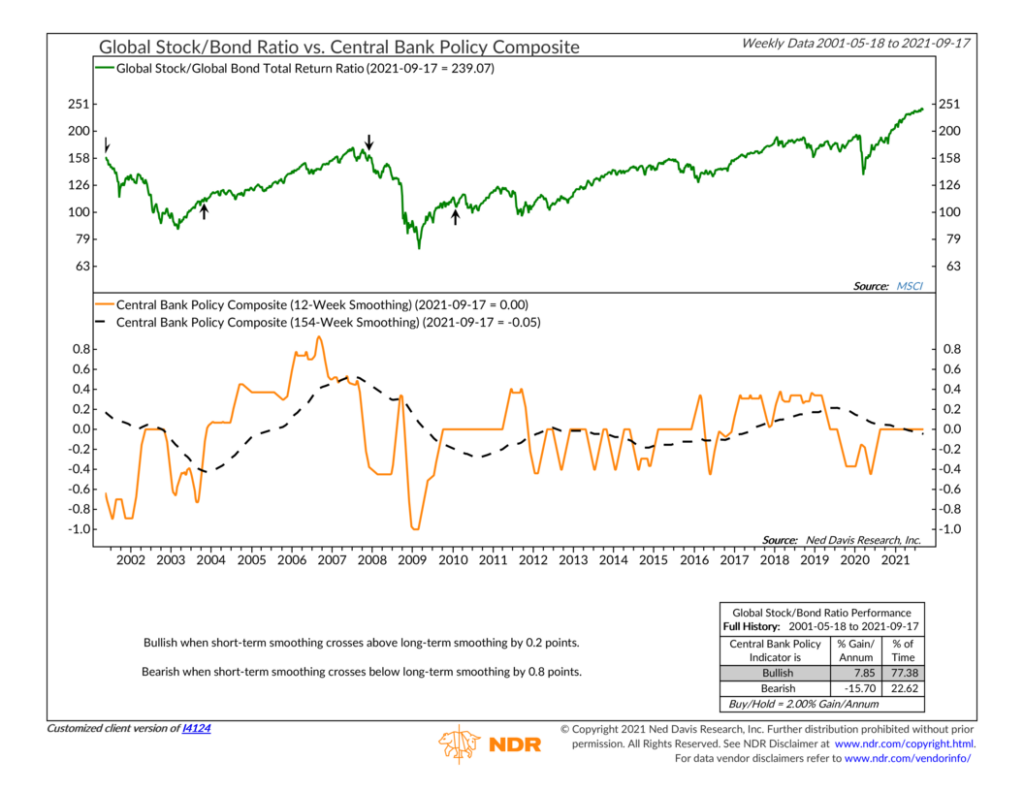
With this concept in mind, we turn to our featured indicator above. The chart is based on the Central Bank Monetary Policy Composite (bottom clip) and how it affects the performance of the global stock/bond ratio (top clip). The Central Bank Monetary Policy Composite is the weighted average change in the short-term interest rate targeted by the U.S. Federal Reserve, the Bank of Japan, the Bank of England, and the European Central Bank. If this series is rising, it means central banks are tightening (raising rates). But when it is falling, central banks are easing (lowering rates).
We’ve found that when the 12-week average of the Central Bank Policy Composite (orange line) rises more than 0.2 points above the 154-week average (black dashed line), it’s a sign that central banks are embarking on a tightening cycle. This is good for stocks because it means the economy is in good shape. The last positive signal was back in 2010, and stocks have been in a long-term bull market relative to bonds ever since.
If the orange line were to fall more than 0.8 points below the black dashed line, it would signal that the central banks were going down the easing policy path (i.e., lowering rates to stimulate a sluggish economy). Interestingly, despite a recession last year due to the pandemic, short-term rates never fell far enough relative to their recent average to trigger a sell signal for stocks. In hindsight, this was the correct call, as the economy bounced back much quicker this time around than it has from prior recessions in history.
Overall, this is a very useful indicator as it helps us gauge what the world’s major central banks are doing interest rate-wise. If they are raising rates due to a more robust economy, it’s probably a good time to be more invested in the stock market. However, if they are lowering rates to stimulate a poor economy, it might make sense to increase your allocation to bonds versus stocks.
That bottom line is that central banks are big players in the financial markets, there’s no denying that. So it’s important that we pay attention whenever they make a move.
This is intended for informational purposes only and should not be used as the primary basis for an investment decision. Consult an advisor for your personal situation.
Indices mentioned are unmanaged, do not incur fees, and cannot be invested into directly.
Past performance does not guarantee future results.