The markets are getting bumpy, so let’s dive into this week’s topic: the SHUT Index and what it’s revealing about the current state of financial markets.
The SHUT Index, which stands for Staples, Healthcare, Utilities, and Telecommunications, includes sectors that are often considered “defensive.” These sectors are more stable and less prone to wild price swings than the broader market. Why? Because these industries provide essential products and services that people need, no matter what the economy is doing. When the overall stock market is struggling, investors often turn to these sectors for safety.
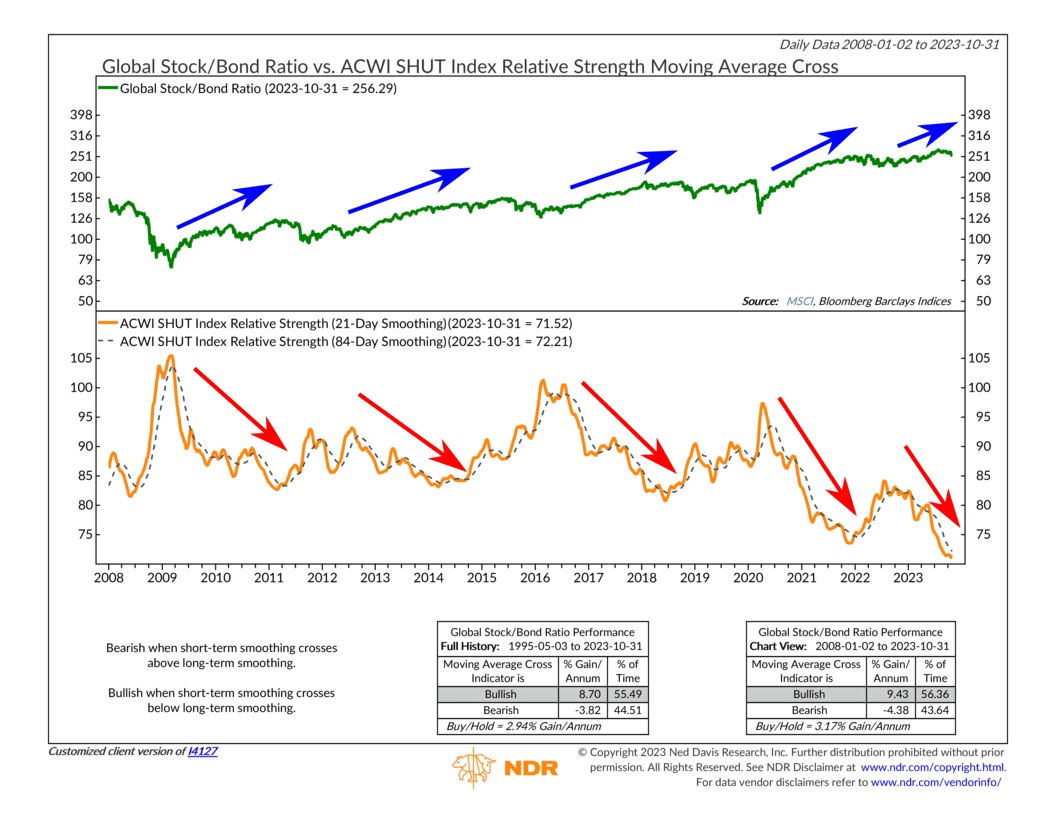
This is where our indicator comes into play. The orange line in the lower chart shows how the SHUT Index is performing compared to the global stock market. When it’s going up, it means the SHUT sectors are doing better than the rest of the market. But when it’s going down, it means these sectors are lagging.
The arrows on the chart reveal the fact that, historically, stocks tend to perform best when the SHUT Index’s relative strength line is falling. This makes sense because when investors are feeling more adventurous and willing to take risks, they tend to move away from the safety of SHUT sectors and into riskier parts of the market. However, when risk aversion increases, the SHUT Index rises, and the broader market tends to perform poorly.
So, what is the SHUT Index telling us about the current situation? Well, so far, the message is positive. The SHUT Index continues to fall compared to its position last year. Investors aren’t rushing to the safety of the SHUT sectors (at least not yet), even though the broader market has entered a correction phase.
In other words, investors aren’t exactly “shutting the door” (pardon the pun) on the stock market just yet. According to this indicator, the risk of a more significant market downturn appears to be low—unless we start to see a sharp increase in the SHUT Index, along with other signs that investors are becoming more risk-averse.
This is intended for informational purposes only and should not be used as the primary basis for an investment decision. Consult an advisor for your personal situation.
Indices mentioned are unmanaged, do not incur fees, and cannot be invested into directly.
Past performance does not guarantee future results.
The S&P 500 Index, or Standard & Poor’s 500 Index, is a market-capitalization-weighted index of 500 leading publicly traded companies in the U.S.
