Let’s say you have some money saved up, and you want to put that money to work as an investment. One option you have is to buy stock issued by publicly traded companies. The idea, of course, is that the shares of stock you buy will appreciate as time goes on, and you can then sell your shares to someone else later and make a profit. But what makes those shares more valuable over time?
The most straightforward answer is earnings. Presumably, companies are raising money in the financial markets to engage in commerce, and when they do that profitably, those profits flow back to the owners of their stock, in one form or another. Therefore, it shouldn’t be too surprising that when companies are growing their profits at a faster rate than before, their stock prices tend to go up as well.
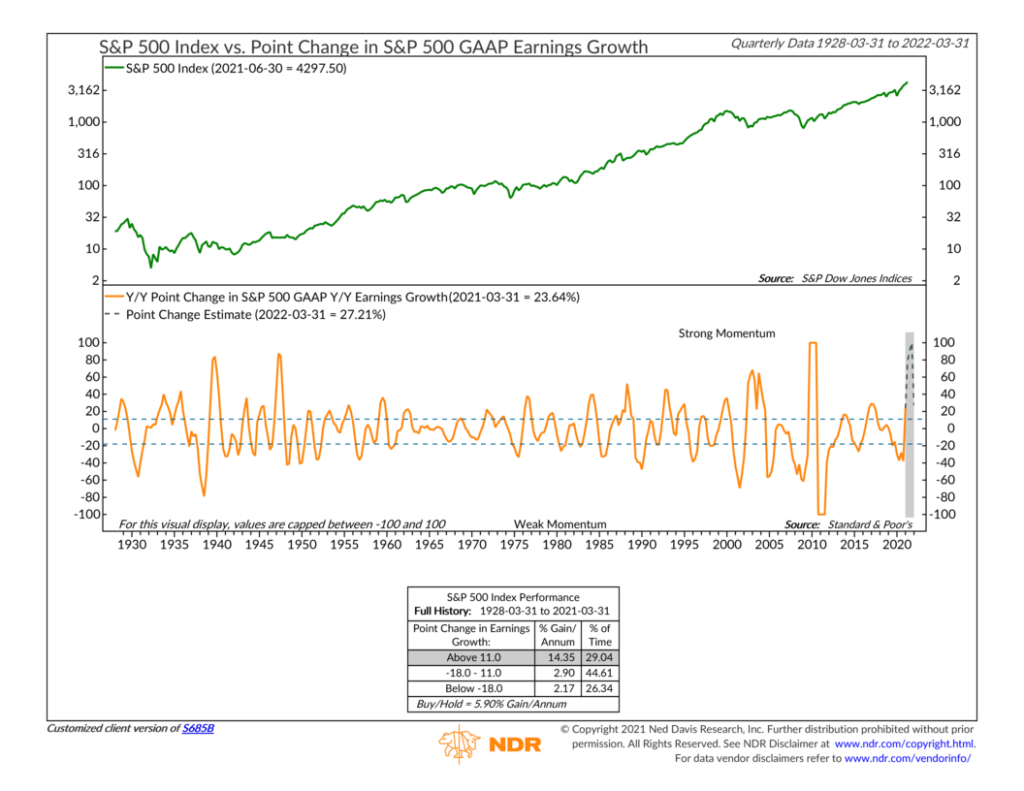
That’s the basic theory behind our featured indicator of the week, shown in the chart above. On top, you’ll see the long-term performance of the S&P 500 stock market index, going back to before 1930. On the bottom, represented by the orange line, is the year-to-year change in the year-to-change in the S&P 500 earnings per share growth. In other words, it measures earnings growth acceleration.
I like to think of this in terms of driving your car down the highway. Let’s say you’re trucking along at 50 miles per hour, but then you accelerate to 60 miles per hour one second later. Your speed increased by 10 miles per hour in one second (or 20%). That measure—acceleration—is what our indicator is evaluating but applied to the year-over-year growth in corporate earnings or profits.
Back to the stock market, we find that the strongest gains for the stock market have come when the earnings growth rate has accelerated at least 11% higher from where it was a year ago. On average, the S&P 500 has gained over 14% per year when this is the case. However, when the earnings growth rate is losing momentum—more than 18% lower than where it was a year ago—the S&P 500’s returns have been a mere 2% per year, on average.
As you probably notice by looking at the chart, earnings growth momentum has varied significantly over time. This is because earnings acceleration is notoriously difficult to maintain—except when coming out of recession.
Fortunately, that’s where we find ourselves today. The latest update to the indicator showed a strong upturn in earnings growth momentum last quarter—to above the 11% bullish threshold. And going forward, earnings growth is expected to accelerate further the rest of the year.
However, by the first quarter of next year, the growth rate is already expected to cool off. As momentum fades further from there, stock market gains will likely be harder to come by.
This is intended for informational purposes only and should not be used as the primary basis for an investment decision. Consult an advisor for your personal situation.
Indices mentioned are unmanaged, do not incur fees, and cannot be invested into directly.
Past performance does not guarantee future results.
