This week’s indicator is all about the economy. It’s a composite indicator comprising six individual indicators that each track some sort of economic activity—ranging from stock market earnings and industrial production to layoff announcements and various other economic data.
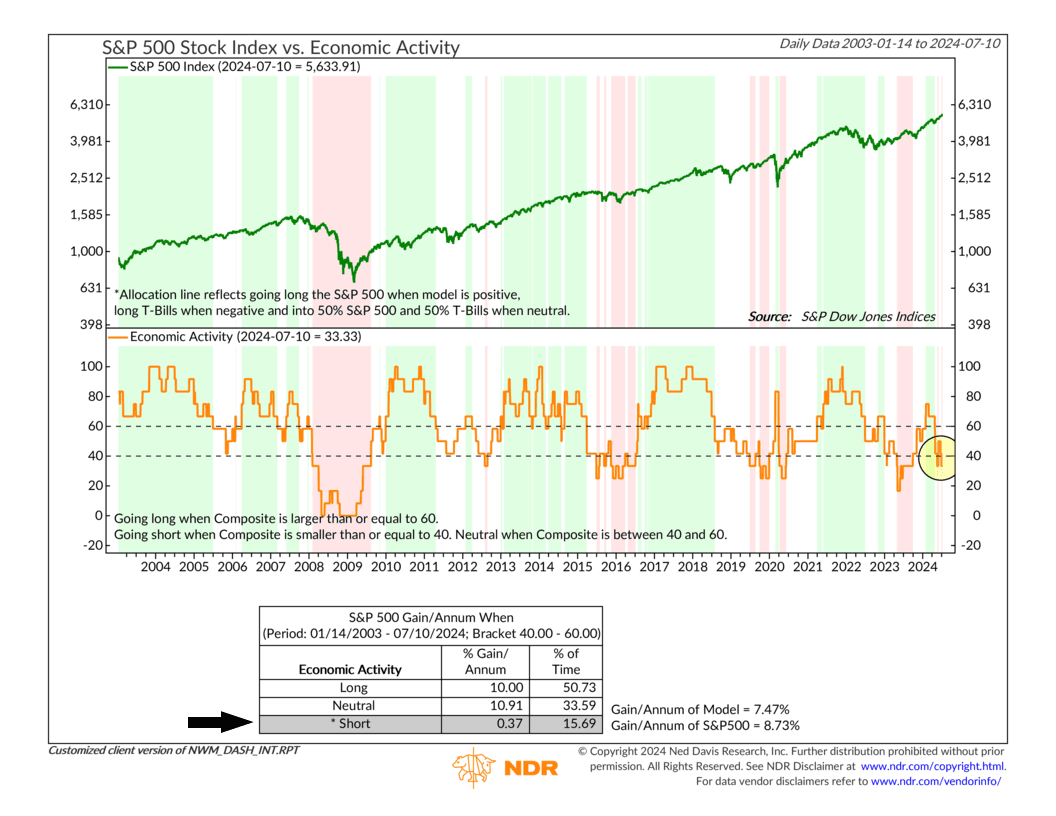
When we cobble these six indicators together, we get the composite indicator, shown as the orange line on the chart above.
Historically, when this composite reading has been Long (above 60) or Neutral (above 40), the S&P 500 has performed well, with annual gains exceeding 10%.
However, the trouble starts when the composite indicator drops below 40. This threshold signals a significant slowdown in economic activity, creating a challenging environment for stock returns. Indeed, the S&P 500’s annualized return plummets to just 0.37% in such cases.
Unfortunately, we’ve recently crossed into this concerning territory. The composite indicator has dropped to approximately 33 in recent weeks. Although it started the year strong, we’ve seen considerable deterioration recently.
The most recent culprit was the ISM Manufacturing and Services Composite indicator. It weakened and turned negative last month. Additionally, the Citi Economic Surprise Index has also entered negative territory, indicating that recent economic data have been weaker than expected. Throw this on top of weak industrial production and higher-than-average layoffs, and we’ve got a significantly lowered reading for the overall composite indicator.
The bottom line? This recent drop in the composite indicator is a clear signal that economic activity is slowing down. Investors should take note, as this sort of weakening tends to precede periods of lower stock market returns.
This is intended for informational purposes only and should not be used as the primary basis for an investment decision. Consult an advisor for your personal situation.
Indices mentioned are unmanaged, do not incur fees, and cannot be invested into directly.
Past performance does not guarantee future results.
The S&P 500 Index, or Standard & Poor’s 500 Index, is a market-capitalization-weighted index of 500 leading publicly traded companies in the U.S.