In this week’s indicator, we’re taking a closer look at equity ETF flows—and the story they’re telling is hard to ignore.
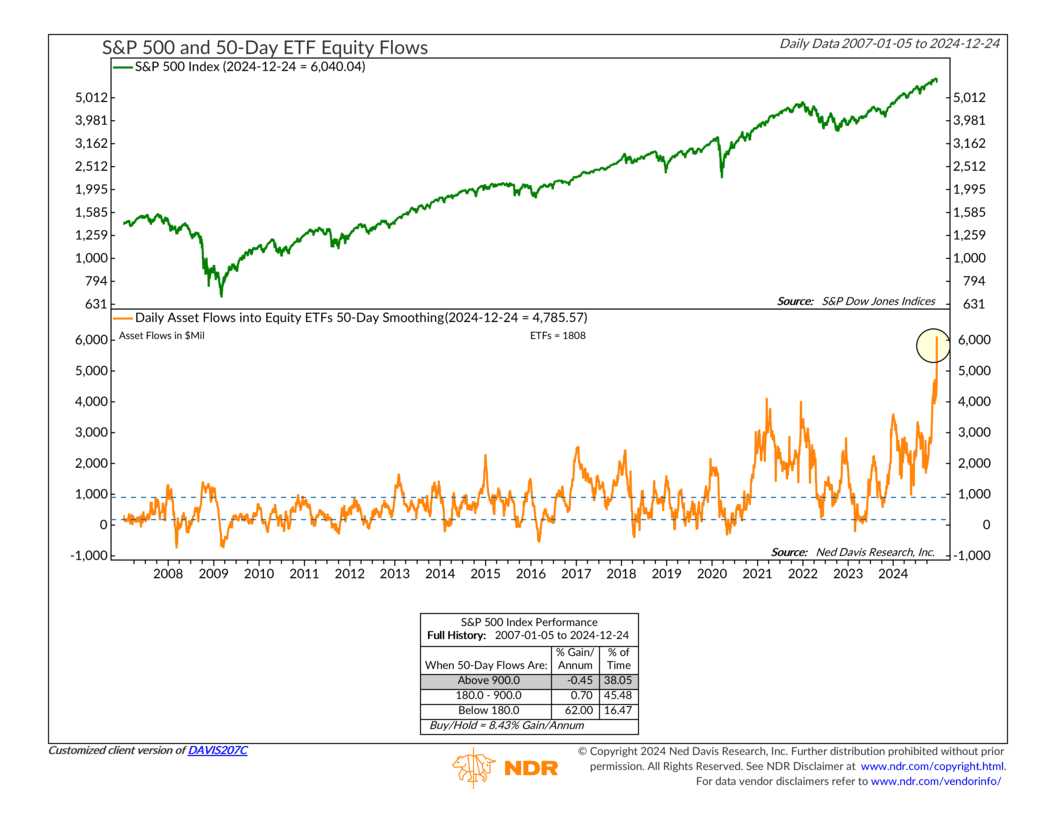
The chart above tracks the 50-day average of daily inflows into U.S. stock funds. This metric smooths out day-to-day noise and gives us a clearer view of trends in investor behavior. Historically, it’s been a reliable gauge of market sentiment, showing us when enthusiasm is running high or when fear is dominating.
How does it work? Well, when this indicator is elevated—like it is now—it suggests investors are piling into the market at an aggressive pace. Historically, this has been a double-edged sword. Periods of heavy inflows, above $900 million on a 50-day average, have typically been followed by weaker market performance, with the S&P 500 delivering negative average annual returns. On the flip side, when inflows drop below $180 million—or even go negative—the market has historically rewarded patient investors with average annualized returns of over 60%.
Right now, the 50-day average has surged to a record $5 billion. This level of inflow is off the charts—literally—and signals that enthusiasm has reached an extreme. When so much money flows into the market at once, it often means the bulk of the buying power is already in, leaving little room for additional gains. Inflows this high tend to act as a warning sign, suggesting that the market may need time to consolidate or even pull back.
What does this mean for investors? While the market remains near its highs, this surge in ETF flows serves as a reminder to temper expectations. Floods of enthusiasm like this don’t tend to last, and the market may need to find a more stable footing before delivering meaningful gains again. For now, it’s a time to stay cautious and keep an eye on how this trend unfolds.
This is intended for informational purposes only and should not be used as the primary basis for an investment decision. Consult an advisor for your personal situation.
Indices mentioned are unmanaged, do not incur fees, and cannot be invested into directly.
Past performance does not guarantee future results.
The S&P 500 Index, or Standard & Poor’s 500 Index, is a market-capitalization-weighted index of 500 leading publicly traded companies in the U.S.
