Central banks play a big role in financial markets. When they adjust interest rates—either cutting or raising them—it has a big impact on financial prices. In recent years, these interest rate movements have been a hot topic. So, for this week’s indicator, we’ll look at how we measure the scope of central bank changes and their effect on stock prices.
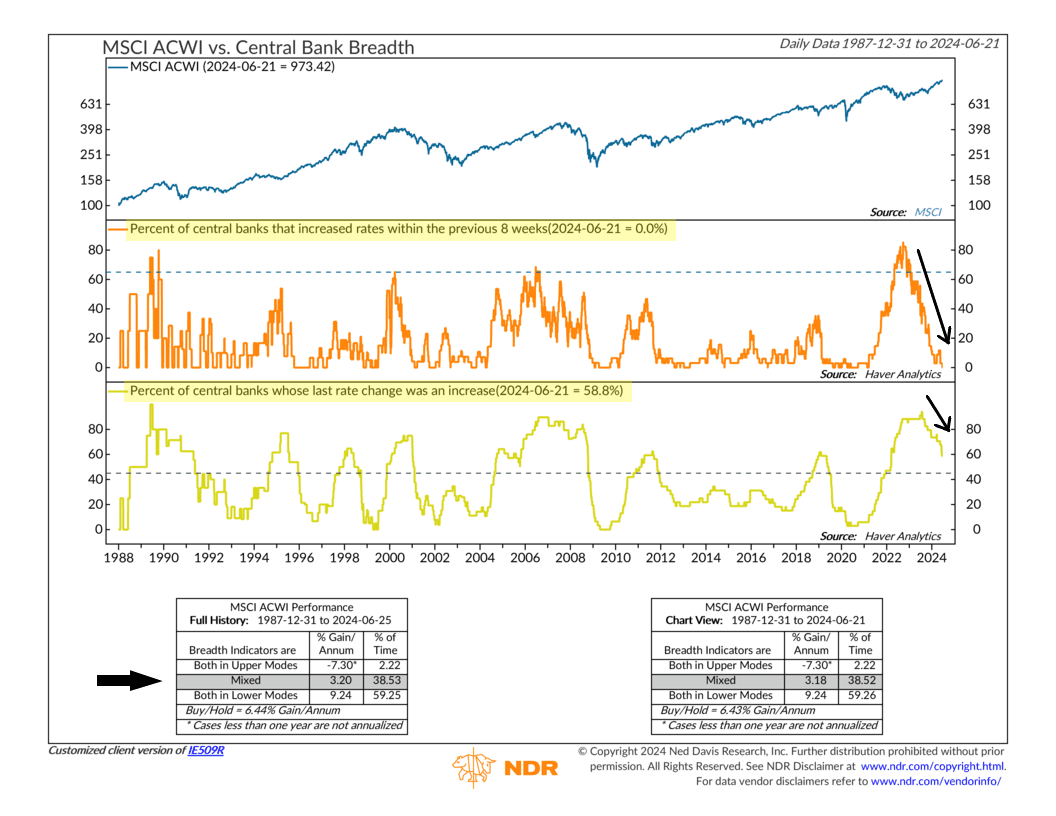
The chart above has three parts. At the top, we have the performance of the MSCI All Country World Index, which tracks companies from developed and emerging markets globally. The middle section displays the percentage of central banks that have raised interest rates in the past 8 weeks. And the bottom section shows the percentage of central banks whose most recent rate change was an increase.
Higher percentages in these last two measures indicate that central banks are more aggressive in raising interest rates. This tends to be bad for equity prices. As the performance box shows, when both measures are high, equity returns are negative (-7.3%). However, when both measures are low, equity returns are above average (9.24%).
But what about when the measures are mixed?
That’s the situation we’re in now. It’s been over 8 weeks since the last central bank raised rates, down from a peak of 85.3% in September 2022. But the percentage of central banks whose last change was an increase is still moderately high, at about 59%. Historically, this mixed scenario has led to below-average stock market gains of around 3%.
The good news? Both measures are trending downwards, indicating that central banks are becoming more dovish (favoring easier monetary policies). Of the 34 central banks included in this indicator, 14 had their last rate change as a decrease. If just 5 more cut rates, this indicator will enter its most bullish zone for stock returns.
The takeaway? Central banks matter for financial markets. By combining two key metrics that track central bank activity, this indicator provides valuable insights for investors. Right now, the consensus is mixed. But the trend seems to be heading in a direction that suggests the era of tight monetary policy is coming to an end.
This is intended for informational purposes only and should not be used as the primary basis for an investment decision. Consult an advisor for your personal situation.
Indices mentioned are unmanaged, do not incur fees, and cannot be invested into directly.
Past performance does not guarantee future results.
The MSCI ACWI captures large and mid cap representation across 23 Developed Markets and 24 Emerging Markets countries. With 2,935 constituents, the index covers approximately 85% of the global investable equity opportunity set.