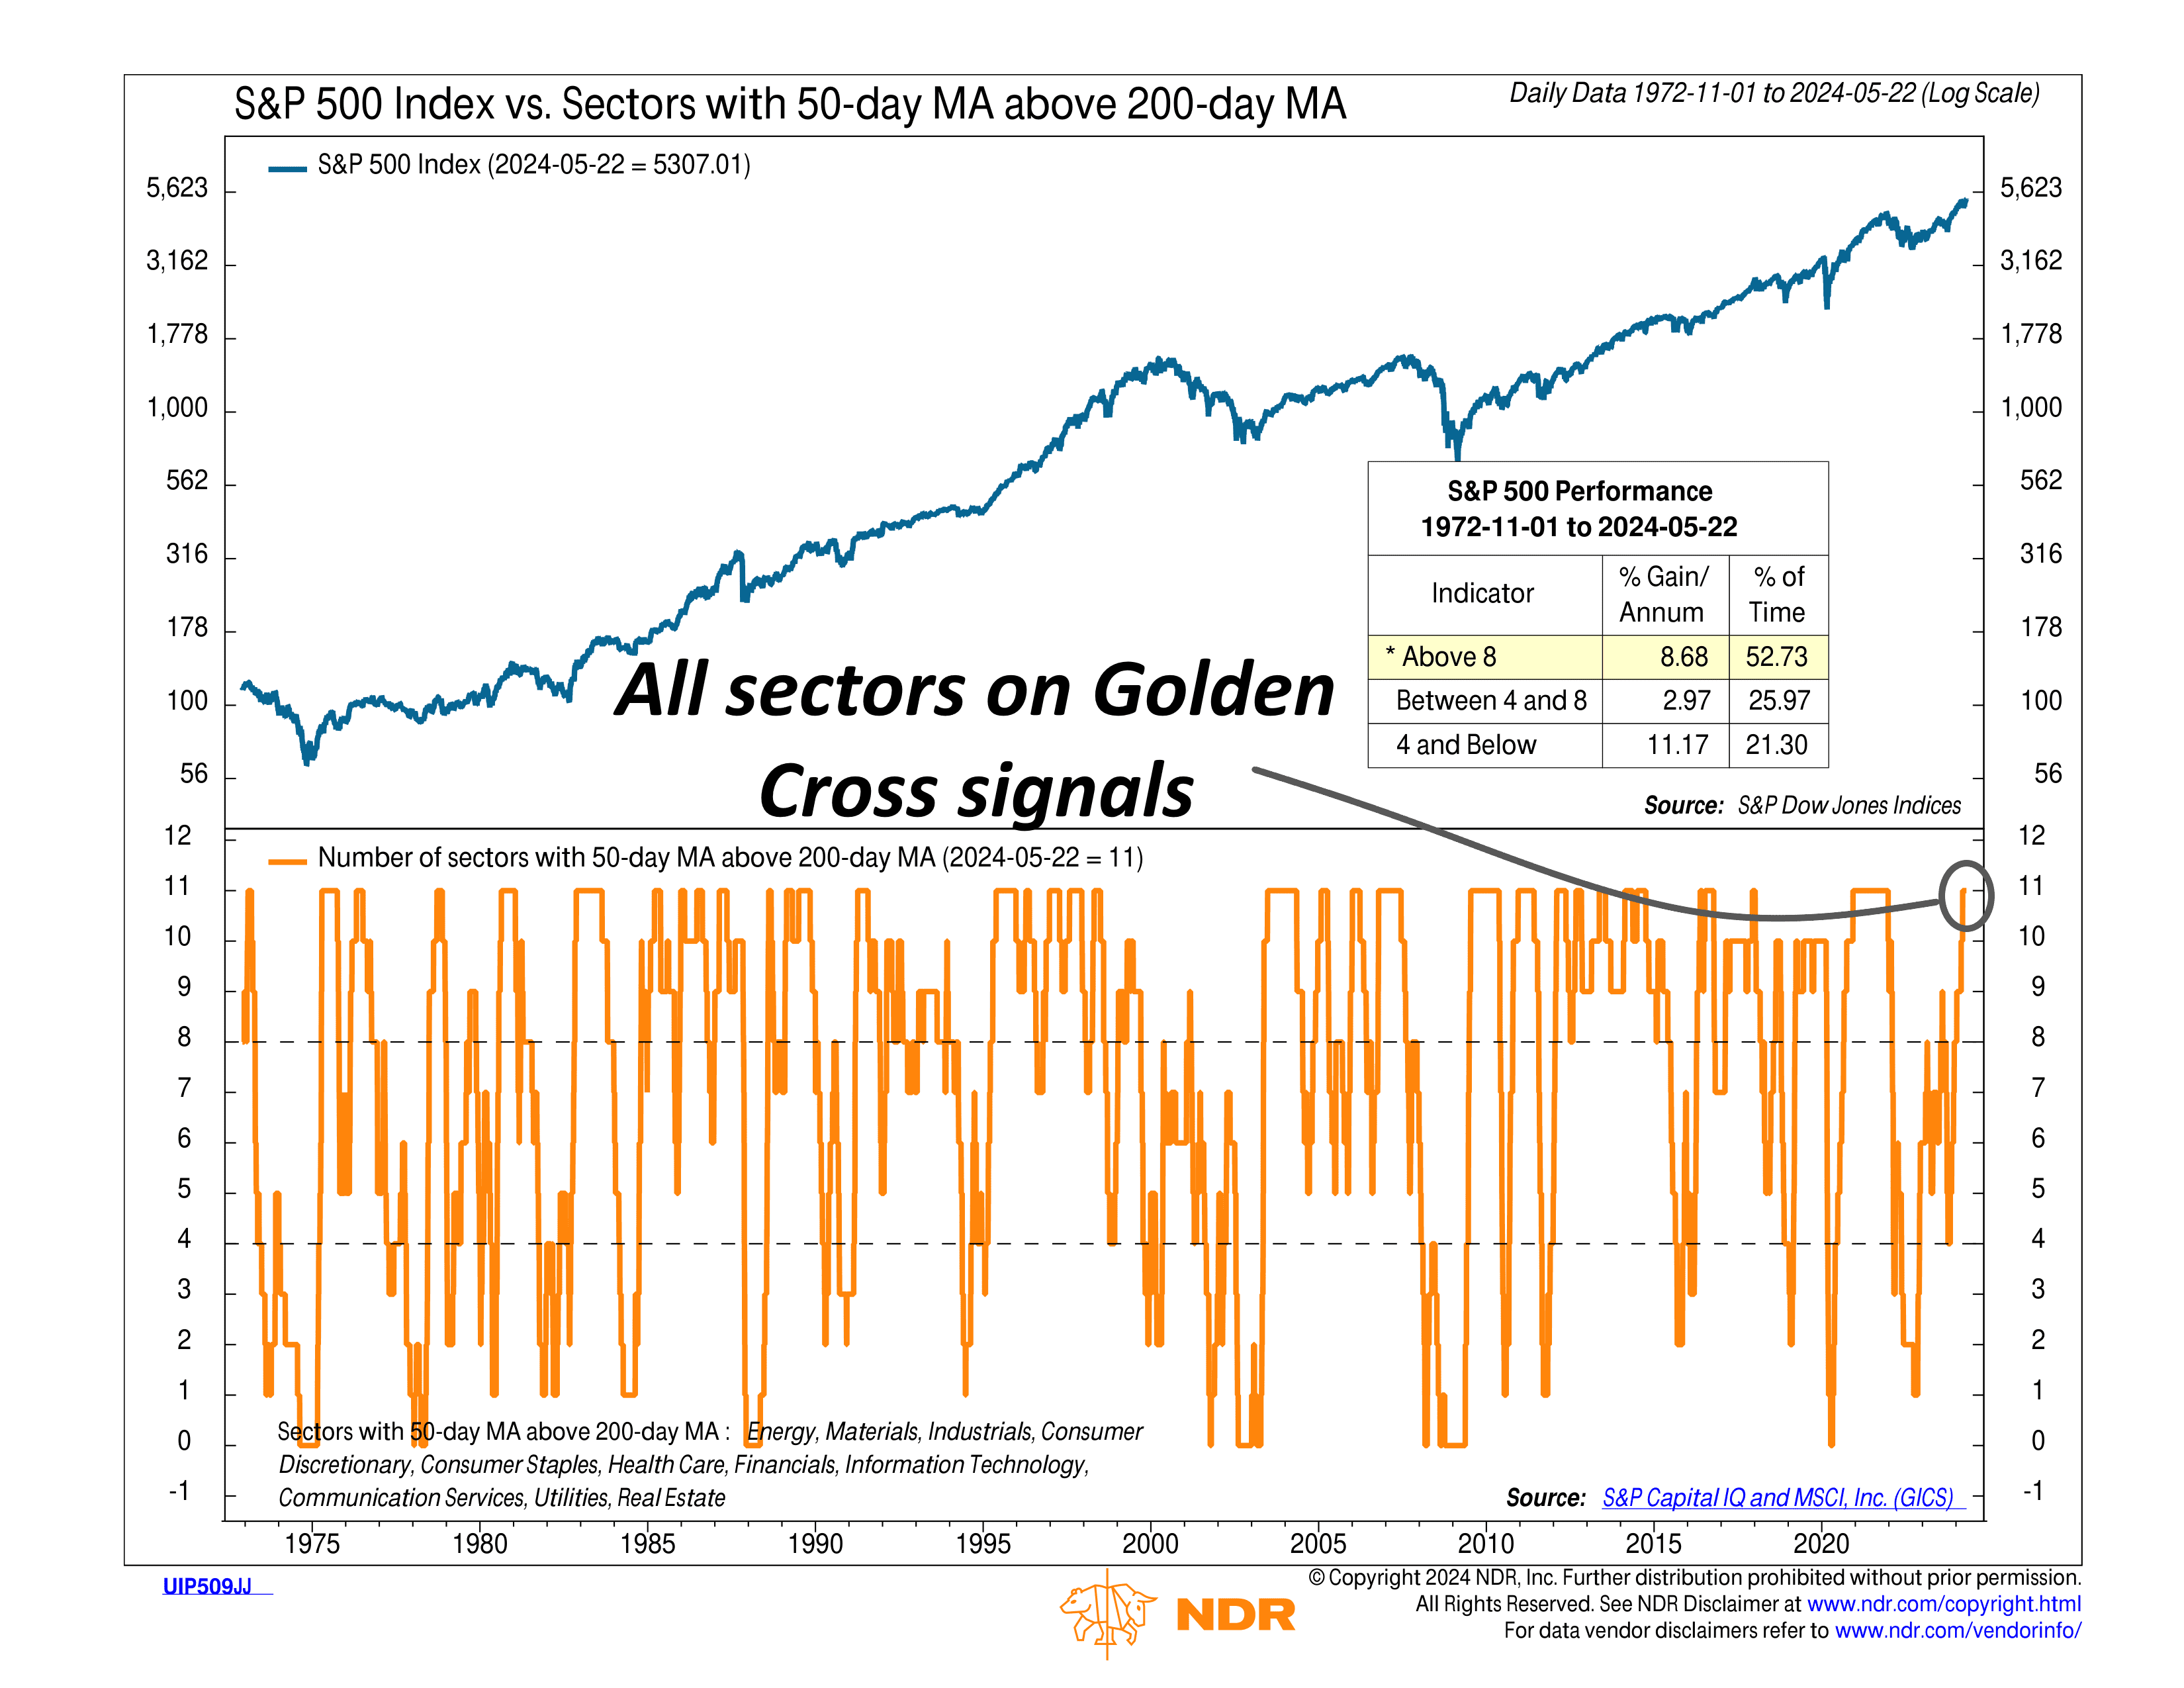
This week’s indicator uses a tool called a golden cross. A golden cross happens when a financial asset’s short-term moving average crosses above its long-term moving average, signaling a bullish trend with increasing momentum.
Typically, we look at the golden cross for something like the S&P 500 Index. When its 50-day moving average rises above its 200-day moving average, the index is considered to be in an uptrend. However, our indicator takes this concept further by applying it to individual sectors within the index.
For example, the orange line on the bottom half of our chart tracks how many of the S&P 500’s 11 sectors have golden crosses, meaning their 50-day moving average is above their 200-day moving average. The historical data shows that when more than 8 sectors are in a golden cross, the S&P 500 tends to perform well, with returns averaging over 8% per year. When only 4 to 8 sectors are in a golden cross, however, returns drop to just under 3% per year. In other words, a broad market advance is bullish for the stock market.
Interestingly, the S&P 500’s best returns occur when 4 or fewer sectors are in golden crosses. This “so bad, it’s good” scenario indicates the market has fallen significantly and is likely near the bottom of the cycle. This happens about 20% of the time and is a reliable signal of a market bottom.
What is the indicator saying now? Well, as you can see, all 11 sectors are registering golden crosses. This is the second most bullish condition on the chart, happening about half of the time.
Therefore, the bottom line is that while this indicator is not foolproof, we think this broad sector participation could be a positive tailwind for stocks going forward.
This is intended for informational purposes only and should not be used as the primary basis for an investment decision. Consult an advisor for your personal situation.
Indices mentioned are unmanaged, do not incur fees, and cannot be invested into directly.
Past performance does not guarantee future results.
The S&P 500 Index, or Standard & Poor’s 500 Index, is a market-capitalization-weighted index of 500 leading publicly traded companies in the U.S
