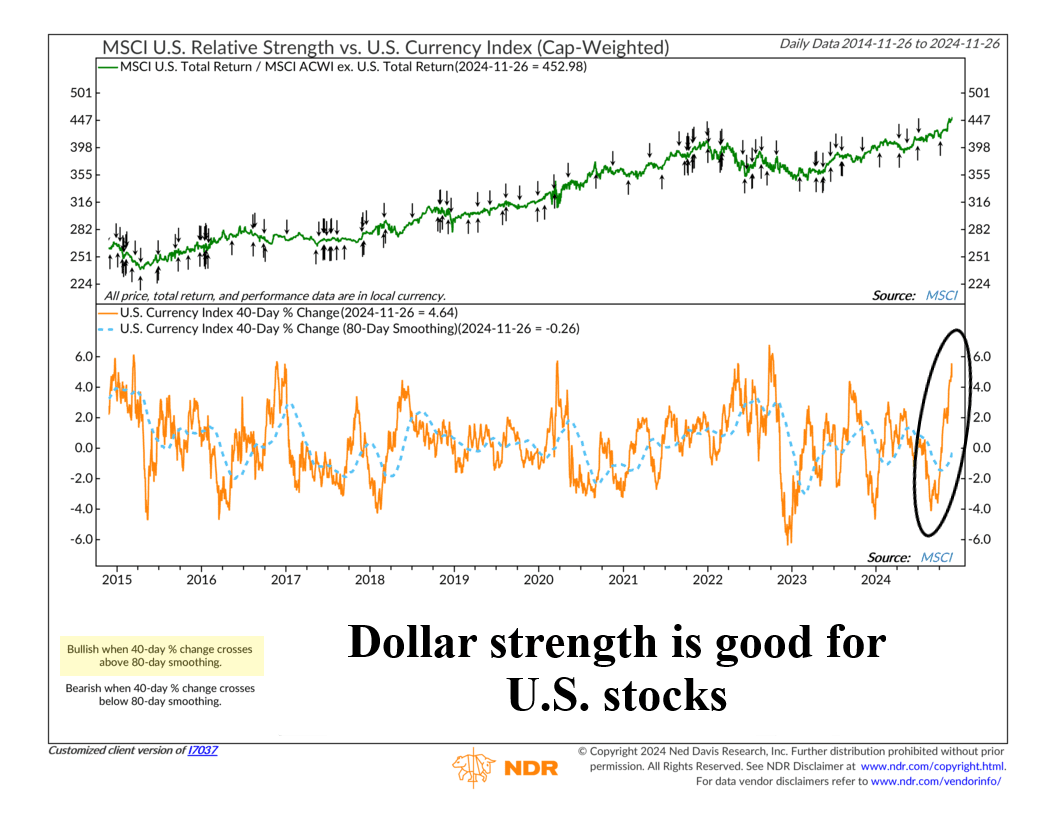
The U.S. dollar has been in the news a lot lately. If you haven’t noticed, the greenback has been flexing its strength against other major currencies. So, this is a great time to introduce this week’s indicator: the MSCI U.S. Relative Strength vs. U.S. Currency Index.
This indicator compares the performance of U.S. stocks to the rest of the world, factoring in the power of the dollar.
Here’s the idea: when the dollar strengthens, U.S. stocks tend to shine. Why? A stronger dollar gives U.S.-based companies a relative advantage, while foreign companies face more currency-related challenges.
Here’s how it works. The indicator measures short-term momentum in the dollar—specifically the 40-day percentage change—and compares it to its smoother, longer-term 80-day trend. When the short-term trend rises above the long-term, it’s a bullish signal.
This happened most recently, near the beginning of October. With the indicator now flashing bullish, U.S. stocks will likely have the upper hand over their international counterparts.
Why? Because historically, this has coincided with stronger performance for U.S. stocks. Since 1995, this setup has delivered an upward trend for the MSCI U.S. Total Return/MSCI ACWI ex. U.S. Total Return ratio when on a bullish signal.
So, the bottom line is that while no signal is foolproof, this one has a pretty solid track record. History shows that when the dollar rises, it often takes U.S. stocks along for the ride—and this could be one of those times.
This is intended for informational purposes only and should not be used as the primary basis for an investment decision. Consult an advisor for your personal situation.
Indices mentioned are unmanaged, do not incur fees, and cannot be invested into directly.
Past performance does not guarantee future results.
The MSCI ACWI captures large and mid cap representation across 23 Developed Markets and 24 Emerging Markets countries. With 2,935 constituents, the index covers approximately 85% of the global investable equity opportunity set.
