For this week’s indicator, we look at the S&P 500’s earnings yield relative to interest rates. This is what we call a “relative valuation” indicator since it helps us determine when the stock market is over/undervalued using the current interest rate environment as a guidepost.
But first, let’s define the terms. The earnings yield is simply what you get when you flip the price-to-earnings (P/E) ratio of a stock or stock index upside down; in other words, it is the earnings-to-price (E/P) ratio. In this case, we take the last four quarters of reported earnings per share of the S&P 500 index and divide by the S&P 500 index value. Therefore, it follows that when the earnings yield is high, stocks tend to be undervalued. And when the earnings yield is low, stocks are generally overvalued.
However, interest rates affect valuations, too. A high earnings yield is less favorable when interest rates are high because bonds are better able to compete for investor’s dollars. Likewise, low earnings yields look better when interest rates are also low because bonds are less competitive.
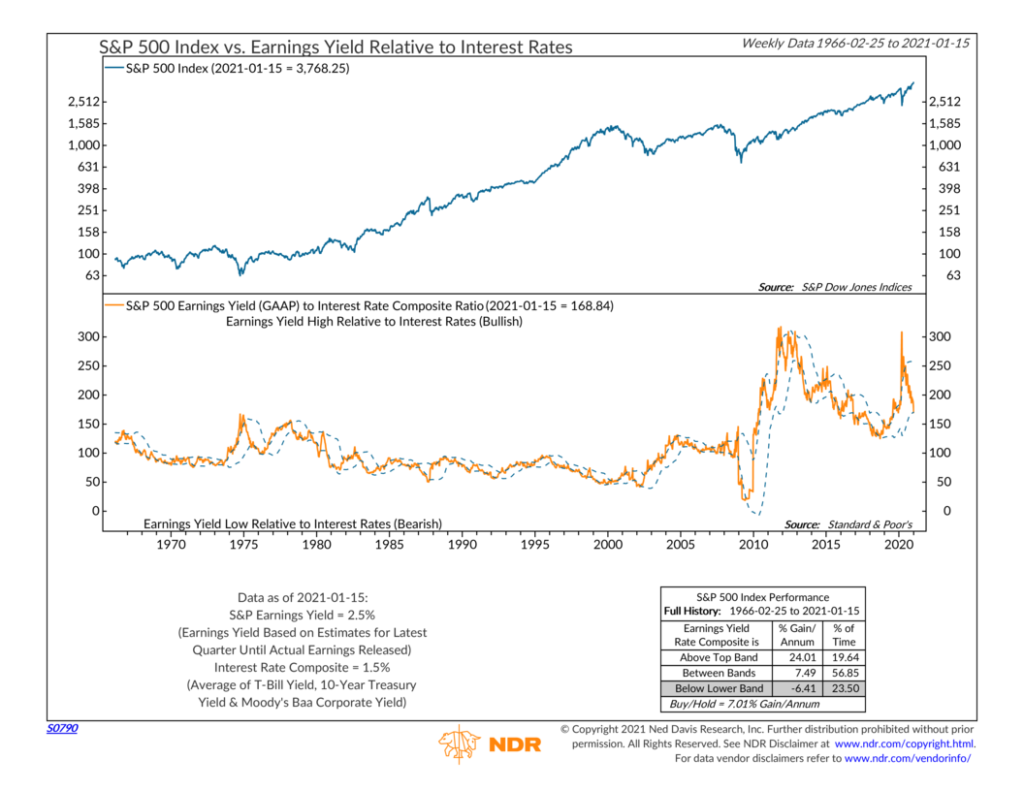
The orange line on the chart above takes all this into account by dividing the S&P 500 earnings yield by an interest rate composite (which is simply an average of 10-year Treasury note yields, 3-month Treasury bill yields, and Moody’s Baa Corporate bond yields). Therefore, when this ratio is high, the earnings yield on stocks looks favorable relative to the current interest rate environment and vice versa.
The indicator uses moving bands (blue dotted line) to represent extreme ratio levels relative to recent past values. What we find is that when the ratio is above the upper band, stocks have shown above-average gains, and when the ratio is below the lower band, stocks have actually lost money.
Looking at the history of this indicator since 1966, we see a big jump in the earnings yield-to-interest rate ratio after the 2008 financial crisis. This was mainly due to the massive drop in interest rates since then, which have made stocks’ earnings yields look much more attractive on a relative basis.
Fortunately, since this indicator uses moving bands based on recent history, we can still determine when stocks have reached extreme valuation levels despite the structural change in interest rates. This indicator is thus a powerful tool for determining stock market valuations in an ever-changing environment.
This is intended for informational purposes only and should not be used as the primary basis for an investment decision. Consult an advisor for your personal situation.
Indices mentioned are unmanaged, do not incur fees, and cannot be invested into directly.
Past performance does not guarantee future results.