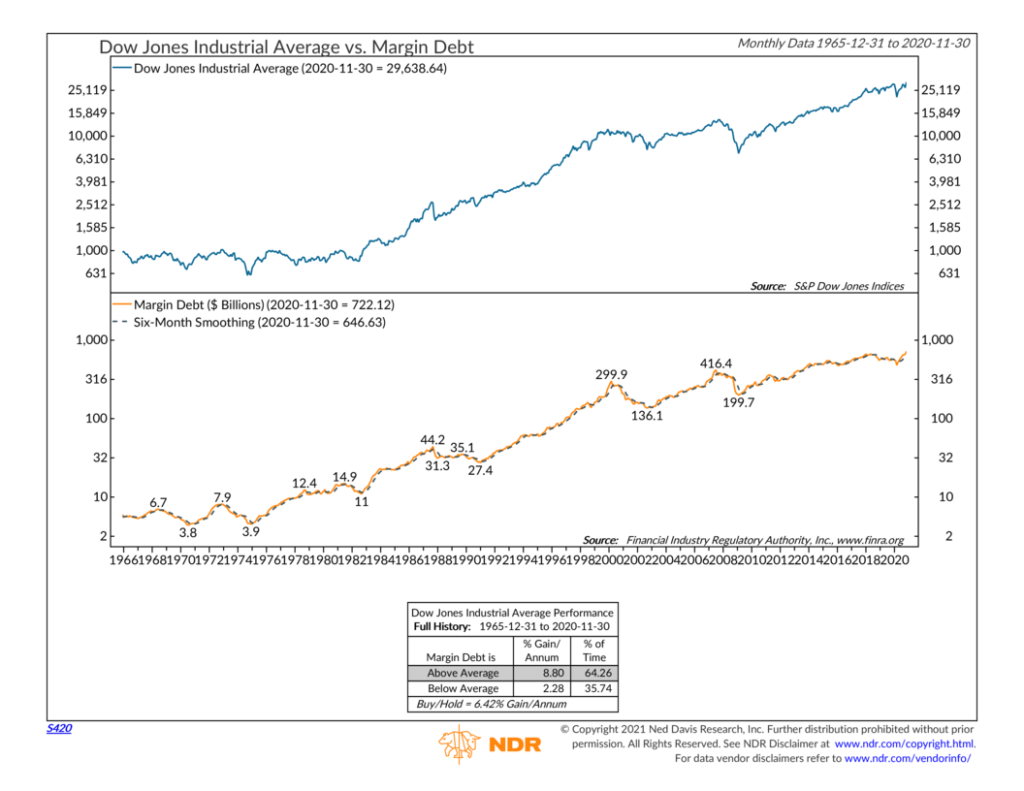
This week’s featured indicator looks at what is called margin debt. When you buy a security from a broker, you can pay all cash for the transaction or borrow some of the required capital from the broker. This is commonly referred to as buying on margin. As a form of leverage, margin debt can significantly enhance returns but also exacerbate losses.
The chart above shows the total amount of margin debt over time and how it has affected stock market returns. Interestingly, we find that when margin debt is rising relative to its six-month average, the stock market (represented here as the Dow Jones Industrial Average) has done quite well. However, when margin debt is falling relative to its six-month average, the stock market has only returned a few percent per year, on average.
When you think about it, this makes sense. A rising stock market attracts speculators who use margin debt to boost their returns. In a positive feedback loop, rising prices attract more margin debt, and more margin debt leads to even higher prices. Eventually, however, this becomes unsustainable. A rise in interest rates, higher margin requirements, or a sustained decline in stock prices forces speculators to sell stocks to reduce their debts, resulting in decreased margin debt.
Therefore, due to this sensitivity to investor sentiment and liquidity, margin debt can be used in conjunction with other indicators to confirm long-term market trends and keep tabs on speculative confidence.
This is intended for informational purposes only and should not be used as the primary basis for an investment decision. Consult an advisor for your personal situation.
Indices mentioned are unmanaged, do not incur fees, and cannot be invested into directly.
Past performance does not guarantee future results.
