One of the biggest drivers of economic growth is government spending. But here’s the funny thing— as this week’s featured indicator reveals, that spending doesn’t always have the same effect on the stock market.
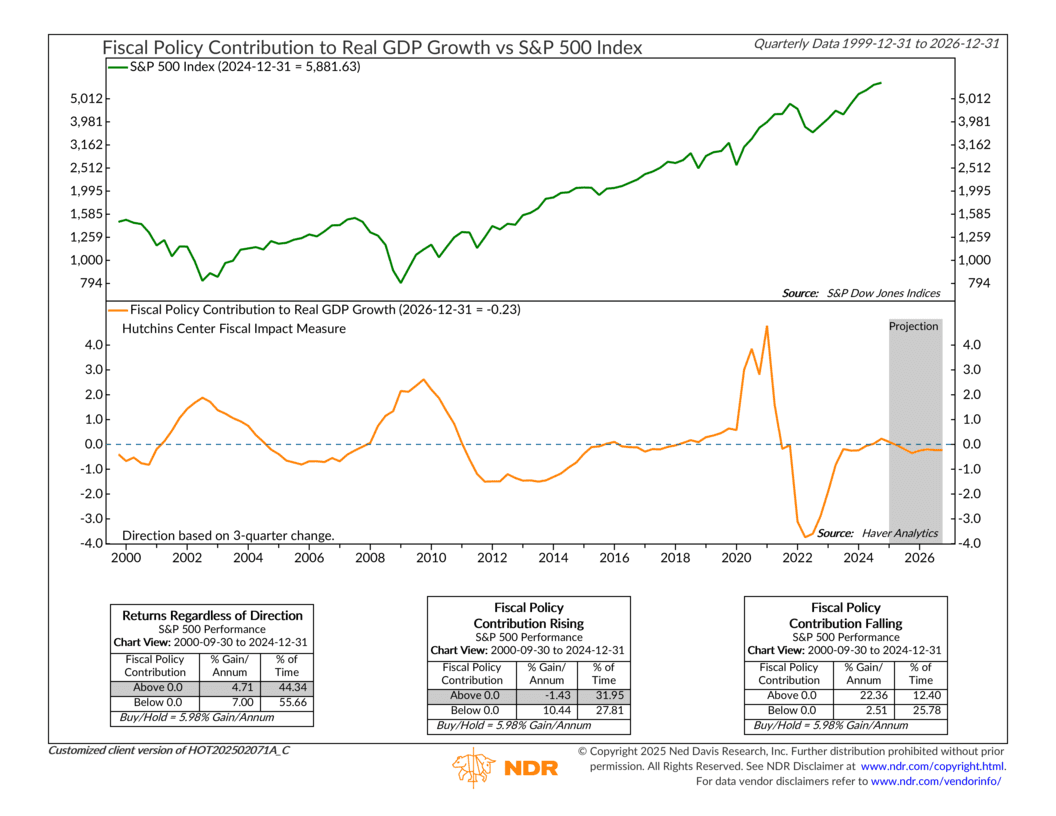
The blue line at the top of the chart tracks the S&P 500, while the orange line at the bottom represents the government’s fiscal policy contribution to real GDP growth, as measured by the Hutchins Center Fiscal Impact Measure. When that orange line is above zero, the government is adding to economic growth. When it’s below, it’s subtracting from it.
The key insight here is that markets tend to struggle when fiscal policy is both rising and positive. Historically, during those periods, the S&P 500 has posted an annualized loss of roughly 1.43%. On the flip side, stocks have done much better when fiscal contributions are declining—or even outright negative.
In other words, when the government is pulling back rather than pumping money into the system, the stock market tends to perform better.
It might seem counterintuitive, but there are reasons for it. When government spending ramps up, it often fuels inflation, forcing the Federal Reserve to raise interest rates. And if there’s one thing markets hate, it’s rising rates. More spending also means higher deficits, which can create long-term economic concerns. But perhaps most importantly, markets like stability. When fiscal policy swings dramatically—whether through spending surges or sudden cutbacks—it introduces uncertainty. And uncertainty is rarely good for stocks.
Looking ahead, the gray projection area suggests fiscal policy will likely decline from current positive levels and remain relatively stable through 2026. That’s a good thing. If that holds, it could provide a welcome boost to a market that’s been stuck in consolidation.
But investors should stay alert. Any unexpected shifts in government spending could ripple through the market in ways history suggests may not be so stock-friendly.
This is intended for informational purposes only and should not be used as the primary basis for an investment decision. Consult an advisor for your personal situation.
Indices mentioned are unmanaged, do not incur fees, and cannot be invested into directly.
Past performance does not guarantee future results.
The S&P 500 Index, or Standard & Poor’s 500 Index, is a market-capitalization-weighted index of 500 leading publicly traded companies in the U.S.