This week’s indicator is all about leverage in the stock market, or what is commonly referred to as margin debt.
What is margin debt? In simple terms, it’s a measure of how much money investors are borrowing to buy stocks. When they do this, it’s called buying on margin. Some investors like this because it can amplify returns. But it also has its downsides. When stocks tumble, it can lead to significant losses.
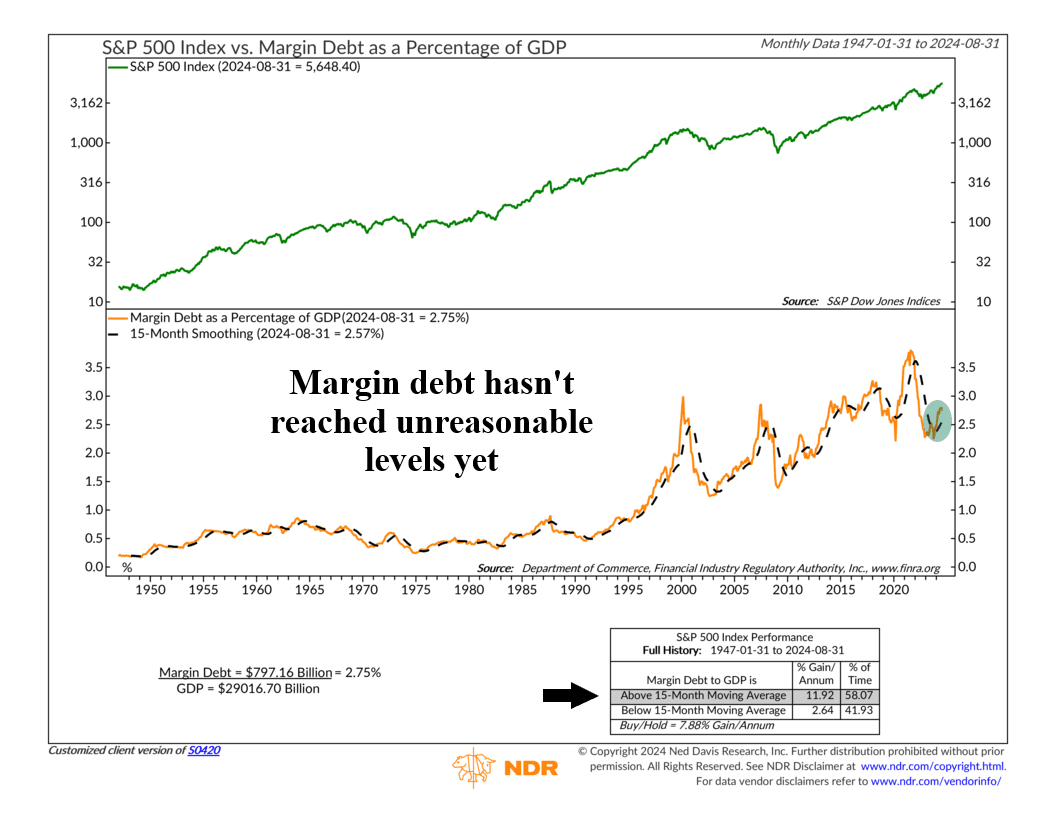
The indicator above is unique because it measures margin debt as percentage of Gross Domestic Product (orange line, bottom clip). Basically, it shows how much money people are borrowing to purchase stocks compared to the size of the economy. This allows us to track margin debt levels more accurately, as both the market and economy grow over time.
So, how do we interpret it? Well, we sort of look at it as a measure of risk appetite. Increasing levels of margin debt tend to coincide with increasing investor optimism, which tends to be good for stock returns. As the performance box shows, when the ratio of margin debt to GDP is above its 15-month average (black dashed line), the S&P 500 has delivered an average annual return of nearly 12%.
However, there’s a cautionary side to this story. Peaks in margin debt often precede market corrections. When margin debt reaches extreme levels relative to the economy, it can be a warning sign of potential instability. Historically, when margin debt has peaked and then dropped below its 15-month average, the S&P 500’s annual returns have fallen to under 3%.
The good news? Right now, margin debt as a percentage of GDP is above its 15-month average, which is a bullish signal. While it has rebounded from last year’s lows, it remains well below the extreme levels seen during past market peaks. Overall, this is a positive indicator for the market.
Looking ahead, this will be a key indicator to watch. While rising debt can reflect investor confidence, it can also hint at complacency. By keeping an eye on shifts in margin debt, we can better gauge when sentiment might be moving too far in one direction.
This is intended for informational purposes only and should not be used as the primary basis for an investment decision. Consult an advisor for your personal situation.
Indices mentioned are unmanaged, do not incur fees, and cannot be invested into directly.
Past performance does not guarantee future results.
The S&P 500 Index, or Standard & Poor’s 500 Index, is a market-capitalization-weighted index of 500 leading publicly traded companies in the U.S.