A lot of the time, when people talk about “the stock market,” they’re talking about the U.S. stock market. Maybe the S&P 500 Index, for example.
But there’s a whole world of other stock markets out there. For instance, the MSCI ACWI (All-Country World Index) includes 23 developed markets and 24 emerging markets, covering a total of 47 markets globally. How these markets are trading can tell us a lot about the overall health of the global financial landscape.
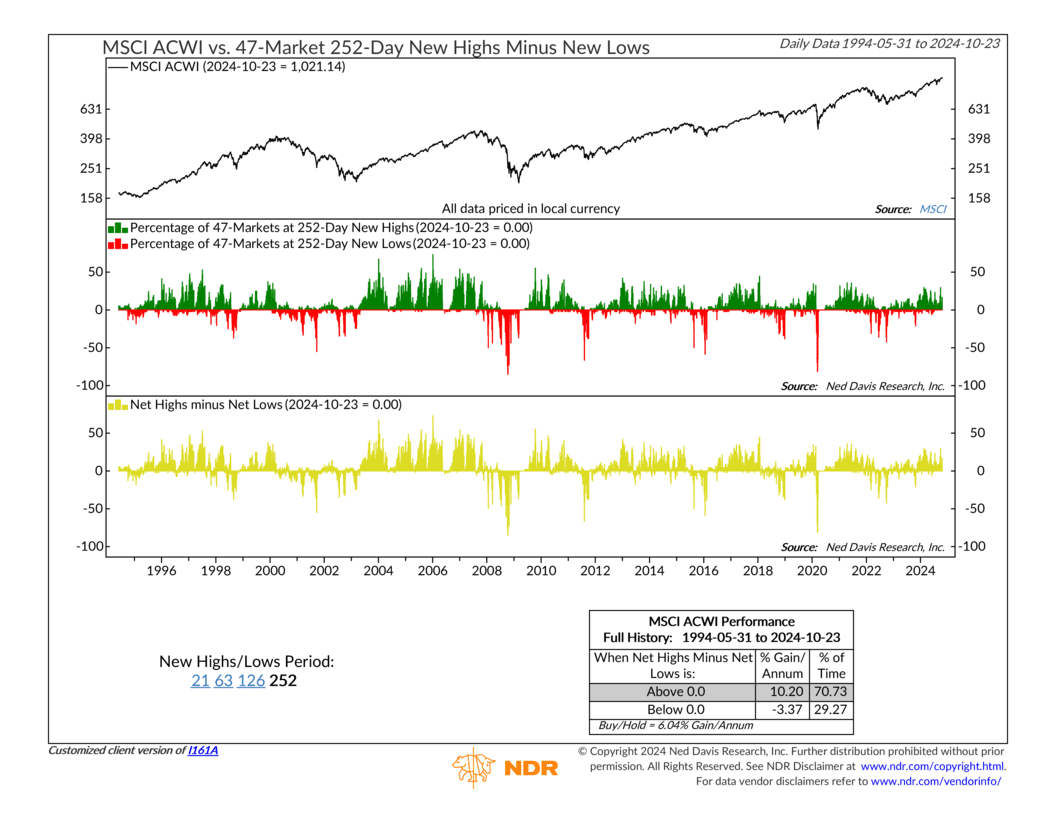
Our indicator looks at the 47 markets in the MSCI ACWI and calculates what percentage of them are trading at new 252-day highs and new 252-day lows. Since there are 252 trading days in a calendar year, this gives us a pretty good snapshot of how the world’s stock markets are trending over the long term.
The indicator is split into three sections. On top, we have the MSCI ACWI’s price level. In the middle, we show the percentage of markets at new highs (green bars) versus the percentage at new lows (red bars). And finally, at the bottom, we simply have the net percentage of highs and lows, meaning new highs minus new lows.
Historically, since 1994, the data shows that when net new highs minus new lows (the gold line) are above zero, global stocks have returned north of 10% per year, on average. On the flip side, when more markets are making new lows (the gold line is below zero), the average annual return for global stocks has dropped into negative territory.
OK, so maybe there’s nothing earth-shattering about that finding. Obviously stocks do better when more of them are making new highs. But in a world full of market noise, sometimes the simplest, most obvious indicators can tell you the most.
This is one of those indicators. And right now, it’s saying we’re still on solid ground, with more markets hitting new highs versus new lows. Keep your eye on this one, because when markets start moving in unison, whether up or down, that’s when the real action happens.
This is intended for informational purposes only and should not be used as the primary basis for an investment decision. Consult an advisor for your personal situation.
Indices mentioned are unmanaged, do not incur fees, and cannot be invested into directly.
Past performance does not guarantee future results.
The MSCI ACWI captures large and mid cap representation across 23 Developed Markets and 24 Emerging Markets countries. With 2,935 constituents, the index covers approximately 85% of the global investable equity opportunity set.
