Participation is an important component of stock market returns. What do I mean by participation? Simply put, it refers to how many stocks within a market index—like the S&P 500—are joining in a rally. The more stocks trending upwards, the healthier the overall rally.
To measure participation, we combine six individual indicators into one composite model, shown here:
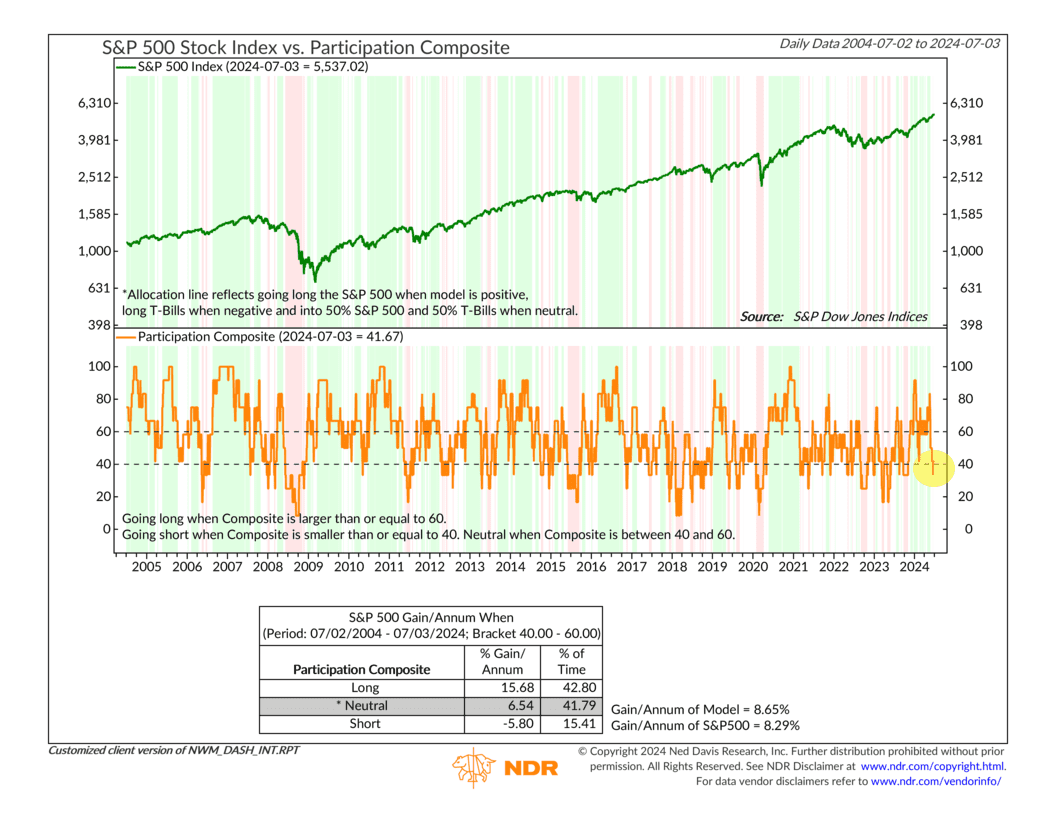
The orange line represents the composite reading, while the green line shows the S&P 500 Index. The performance box at the bottom tells the story: when the composite reading is above 60, S&P 500 returns tend to be above average. But when it’s below 40, returns are usually negative.
The problem today? After strong participation in the first half of the year, the composite reading has plummeted to negative-to-low-neutral levels. This is where stocks generally perform poorly.
The next chart shows just how lousy participation has gotten. It shows the percentage of S&P 500 stocks outperforming the index over a calendar year. As you can see, we’re on pace for a record low, with just over 22% of stock beating the S&P 500 this year.
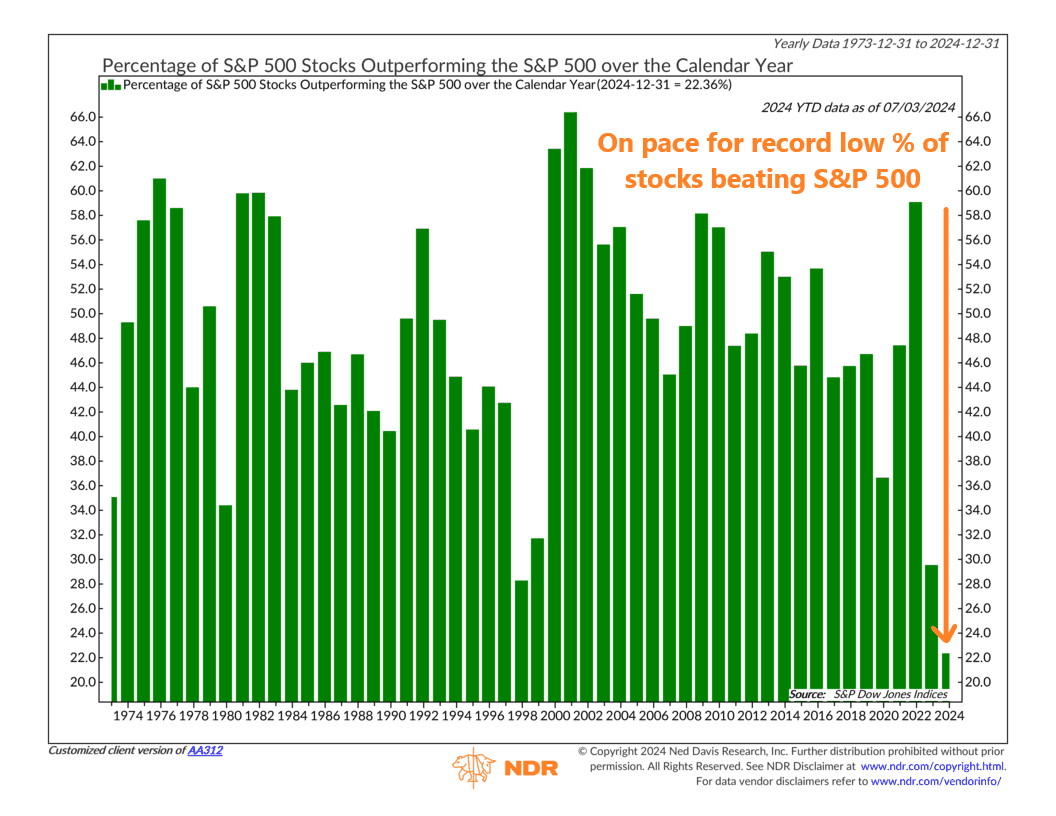
Does this spell doom for stocks? Not necessarily. Last year, only 29% of S&P 500 stocks beat the index, and the index still performed well. However, this narrow breadth signals lingering macro risks like higher interest rates and earnings concentrated in mega caps.
These factors could eventually weigh on a market with weak participation.
This is intended for informational purposes only and should not be used as the primary basis for an investment decision. Consult an advisor for your personal situation.
Indices mentioned are unmanaged, do not incur fees, and cannot be invested into directly.
Past performance does not guarantee future results.
The S&P 500 Index, or Standard & Poor’s 500 Index, is a market-capitalization-weighted index of 500 leading publicly traded companies in the U.S.