This week’s indicator uses the ratio of total Nasdaq volume to total NYSE volume to gauge sentiment in the stock market. The key takeaway is that the ratio is falling, a sign of increasing pessimism—which, from a contrarian perspective, could be a bullish indicator for stock prices.
But first, why do we look at Nasdaq vs. NYSE volume? Well, the Nasdaq is a more speculative stock exchange. It’s easier to list shares on the Nasdaq, and the types of stocks that typically trade on the exchange are more growth-oriented, volatile, and speculative in nature than what is traded on the NYSE—which houses many of the old-guard industrial and blue-chip stocks that have been around for generations.
So, we observe that when traders feel friskier, they tend to trade Nasdaq stocks more, driving up the volume on that exchange. However, when they get nervous, they retreat into hibernation, and Nasdaq volume falls relative to NYSE volume.
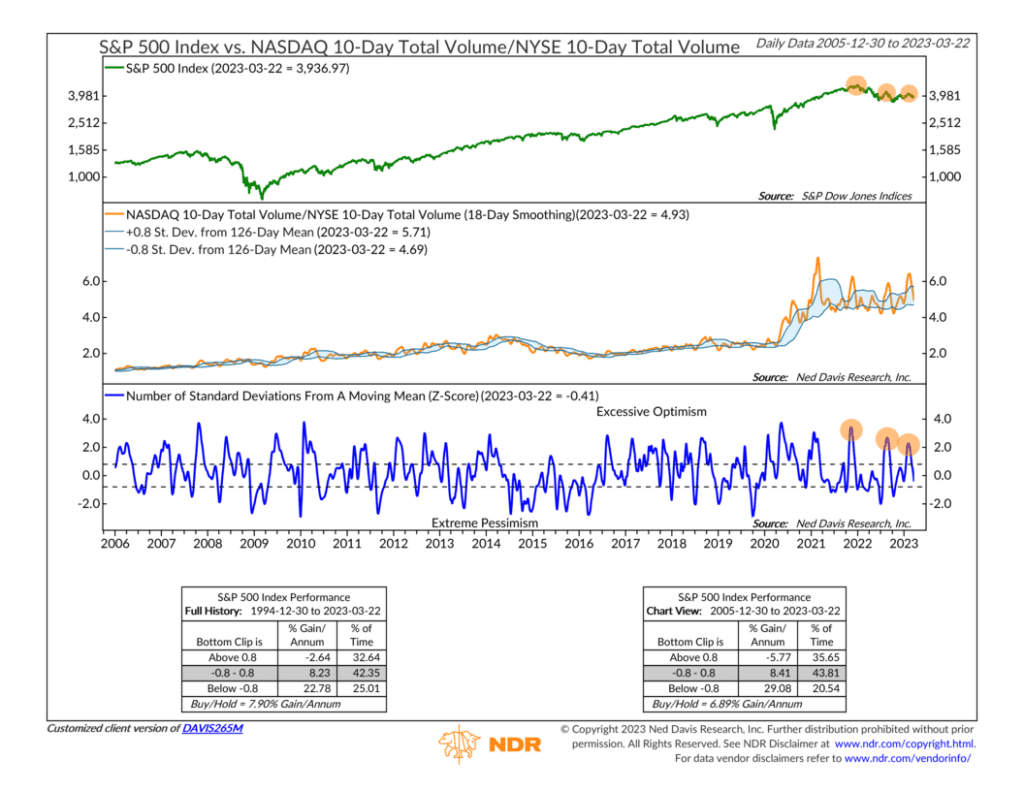
To quantify this, the indicator takes the 10-day total volume of the Nasdaq and divides it by the 10-day total volume of the NYSE to get a ratio—the orange line—that rises when more volume is traded on the Nasdaq versus the NYSE and falls when more volume is traded on the NYSE versus the Nasdaq.
To account for the fact that the ratio can go through structural changes—such as the massive increase in Nasdaq volume after the Covid Crash in 2020—the indicator applies standard deviation brackets around the Nasdaq/NYSE volume ratio. The blue line at the bottom of the graph shows the distance of the ratio from these brackets. This allows us to measure when sentiment has reached excessively high or low levels relative to the ratio’s recent past.
For example, as highlighted on the chart, the past three times the ratio spiked into the upper excessive optimism zone, it coincided with peaks in the S&P 500 Index. In other words, traders were too optimistic, and driving up volume on the more speculative Nasdaq exchange left the overall stock market in an overbought condition.
The potentially good news, however, is that the most recent spike in the ratio—which led to some recent stock price weakness—has peaked and is falling. It’s only in the neutral zone at this point, but if we can see a little bit more optimism washed out of the marketplace, it could create an extremely bullish environment for stock returns.
This is intended for informational purposes only and should not be used as the primary basis for an investment decision. Consult an advisor for your personal situation.
Indices mentioned are unmanaged, do not incur fees, and cannot be invested into directly.
Past performance does not guarantee future results.