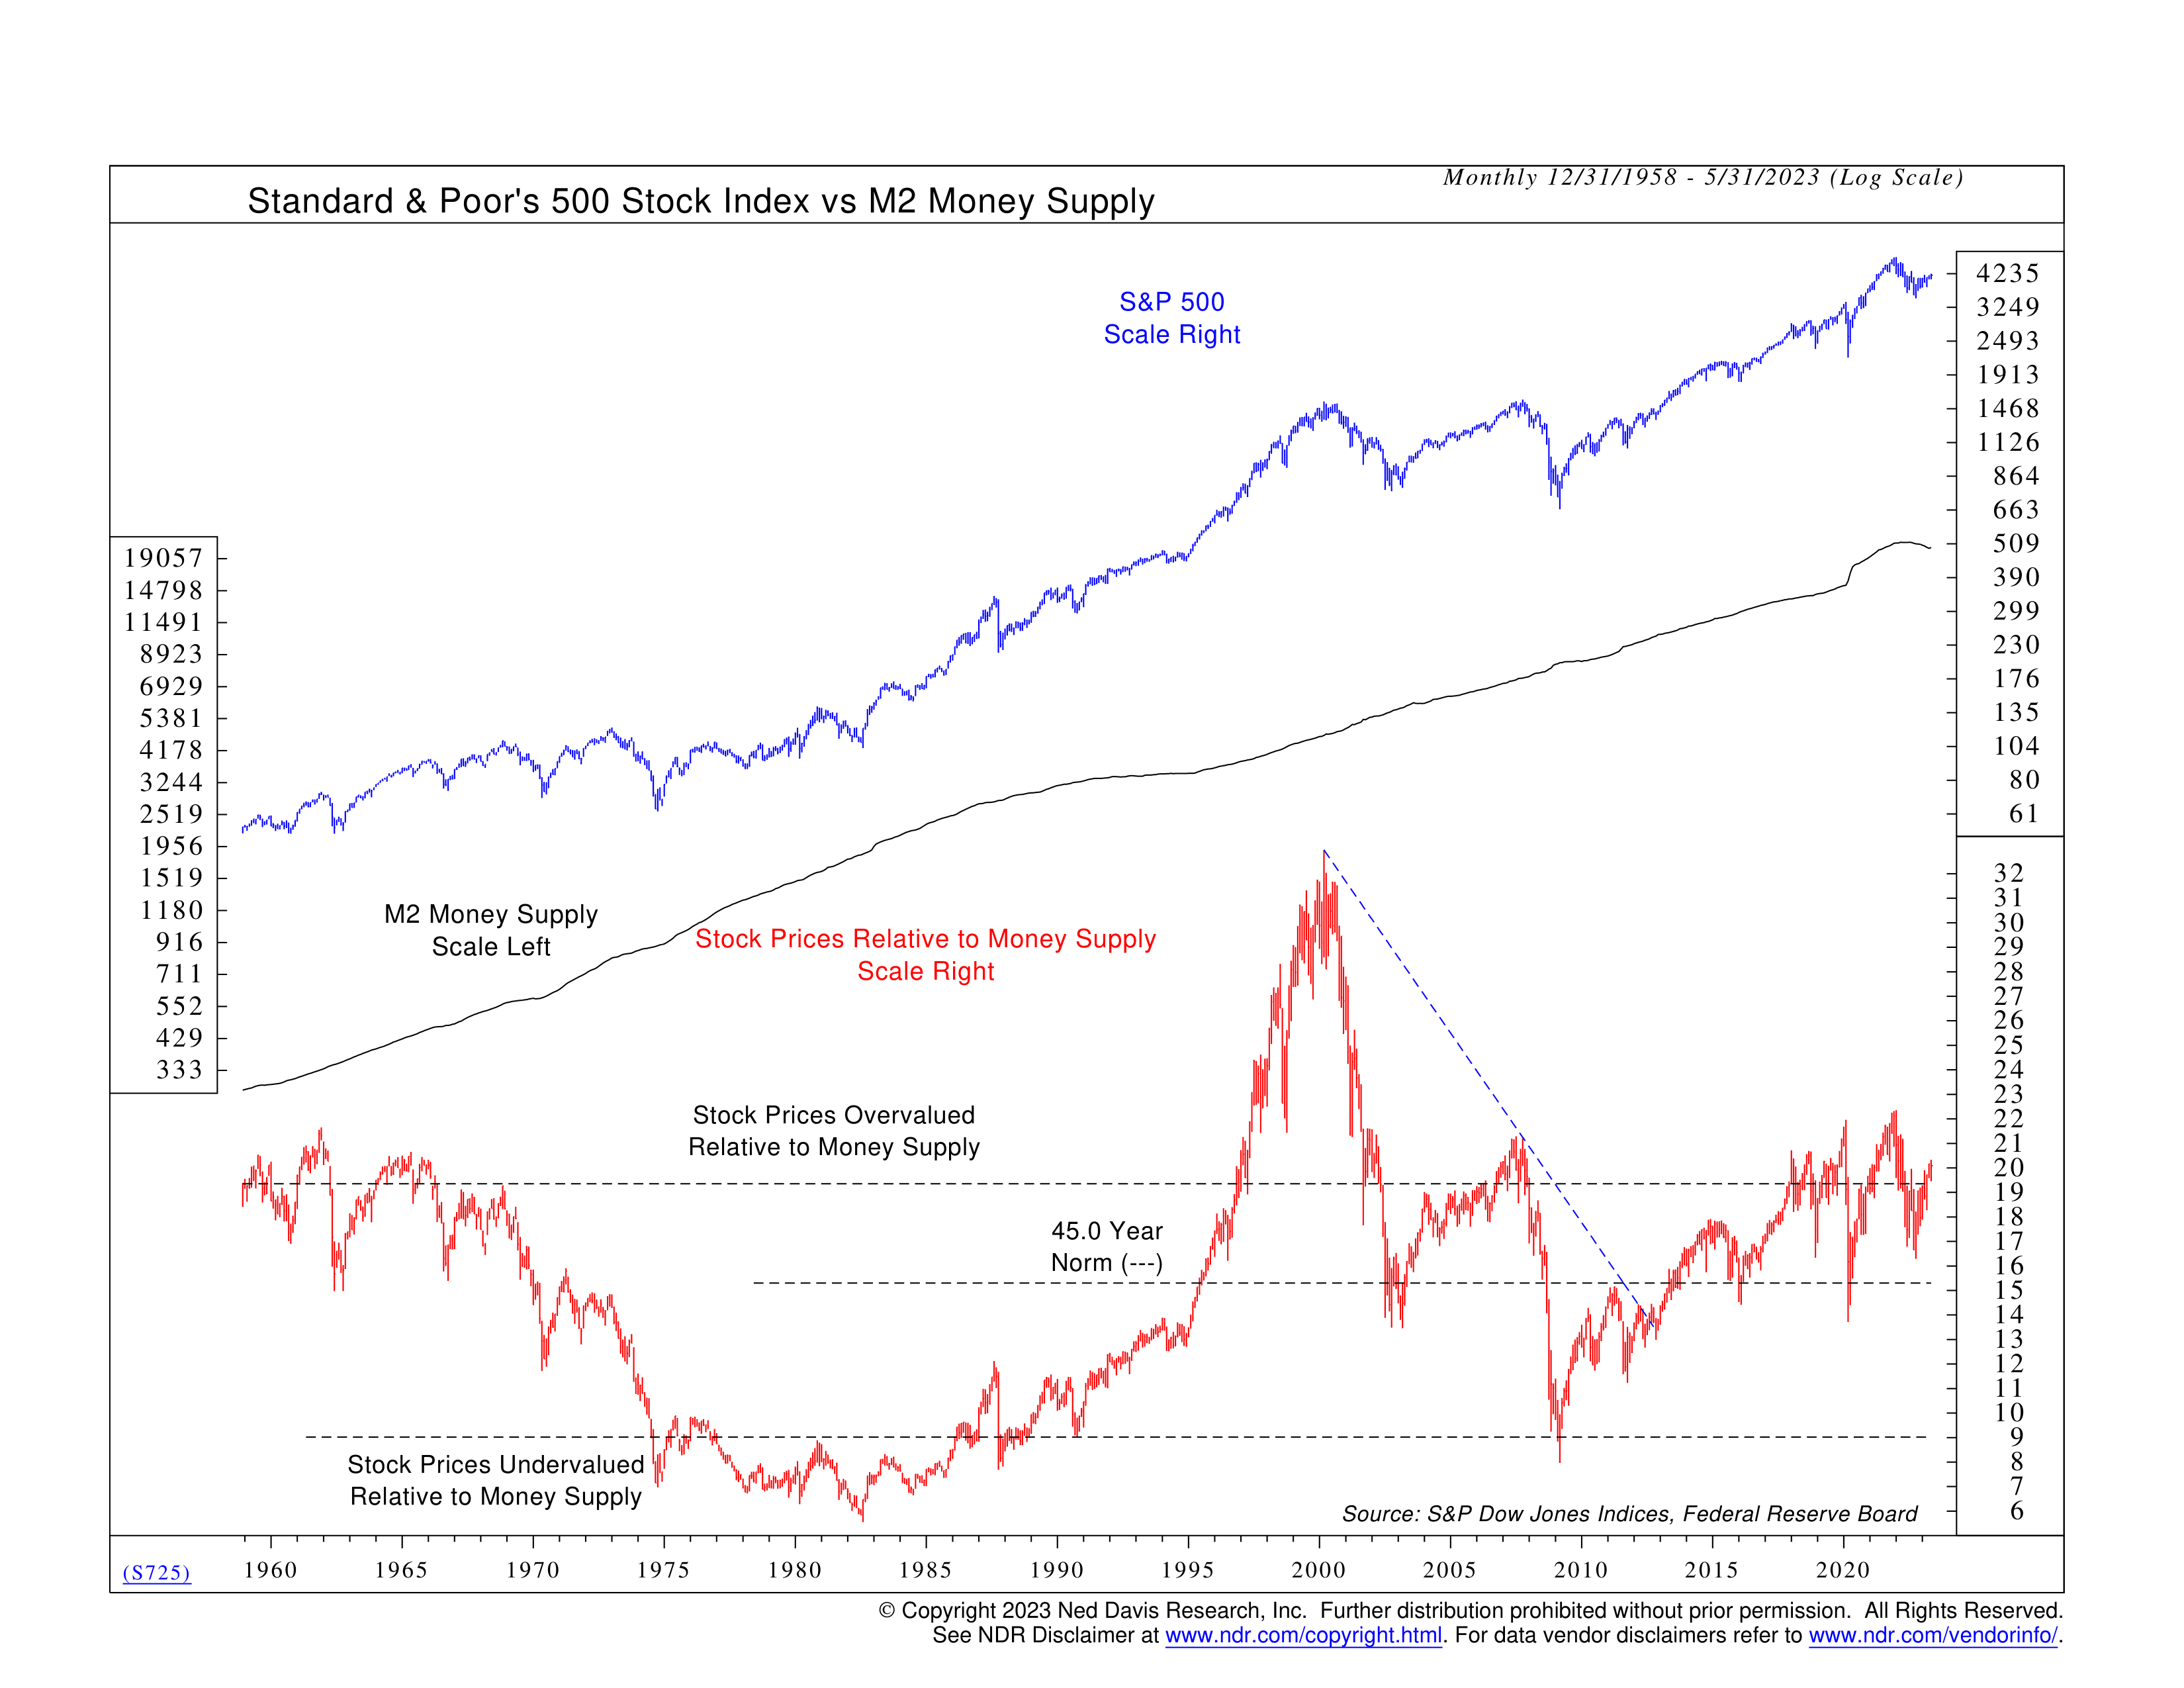
This week’s featured indicator looks at the relative valuation of the stock market based on the money supply. The idea is that if we compare stock prices to some economic gauge—like the money supply—we can determine whether prices are competitively valued or not.
In general, if stock prices are rising faster than the money supply, it’s a sign of an overvalued market—which is bearish for stocks. But if stock prices are growing slower than the money supply, it’s a sign of an undervalued market—which is bullish for stocks.
Here’s how to read the chart. The blue line at the top is the S&P 500 Index, a broad index of U.S. stocks. The black line right below that is the M2 money supply, a broad measure of the United States money supply. And the red line at the bottom is the ratio of the S&P 500 to the M2 money supply.
The dashed black line going through the middle of the ratio represents the 45-year average of the ratio. The dashed lines above and below the average represent historical markers for when the market has gotten over/undervalued.
For example, the obvious instance of an overvalued market occurred at the peak of the Dot-Com Bubble in the early 2000s. The ratio of stock prices to the money supply reached a massive peak right before the bubble burst and the stock market crashed. Interestingly, it wasn’t until 2009 that the ratio dropped below the lower dashed line, at which point the market was considered undervalued a new bull market was underway.
Fast forward to today, and we see that stock prices were extremely high relative to the money supply going into 2022. This was a warning sign that prices had become disconnected from the underlying economy and the money supply—which was shrinking due to tighter monetary policy. Thus, the subsequent decline in stock prices was largely influenced by the dwindling money supply.
The takeaway? The money supply matters for stock prices. Liquidity, or the easy accessibility of cash, has always been a significant driver of stock returns. Indicators like this one help us quantify and illustrate this dynamic in a way that can be used to assess the present risk levels in the market.
This is intended for informational purposes only and should not be used as the primary basis for an investment decision. Consult an advisor for your personal situation.
Indices mentioned are unmanaged, do not incur fees, and cannot be invested into directly.
Past performance does not guarantee future results.
