This week’s indicator is all about regimes. Markets, much like history, operate in distinct regimes, and for the stock market, the two biggest drivers of these cycles are economic growth and inflation. Together, they set the stage for the economic scenario the market is navigating.
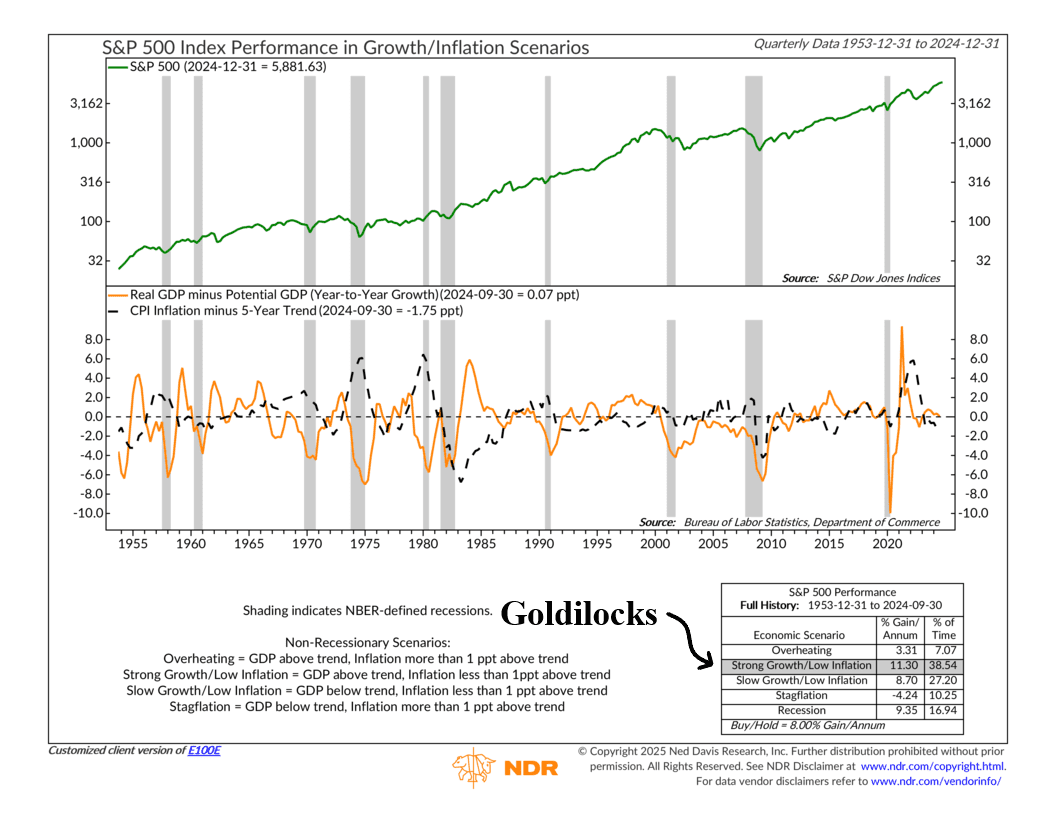
Here’s how it works. The top panel of the chart shows the quarterly returns of the S&P 500—essentially the stock market in action. The bottom panel breaks down two key indicators: GDP growth relative to its potential (the orange line) and inflation compared to its five-year trend (the dotted black line). These two forces combine to categorize the economy into four regimes: Overheating, Strong Growth/Low Inflation, Slow Growth/Low Inflation, and Stagflation.
Not all regimes are created equal. The performance box at the bottom tells the story. The S&P 500 thrives in the Strong Growth/Low Inflation regime, delivering an impressive annualized return of 11.30%. This is the market’s “Goldilocks zone,” where the economy grows without the drag of rising prices. On the other hand, Stagflation—a toxic mix of slow growth and high inflation—is the market’s worst-case scenario, with stocks losing an average of 4.24% per year.
Surprisingly, you might notice that recessions have been far kinder to stocks than most people expect, producing annualized gains of 9.35%. Why? The stock market is forward-looking. By the time a recession is officially declared, the market is often already rebounding, pricing in a recovery and fueled by policy responses like interest rate cuts. Plus, this chart uses quarterly data, which smooths out short-term volatility.
So, where are we now? GDP growth is slightly above potential (+0.07), and inflation is running below its five-year trend (-1.75). That places us in the Strong Growth/Low Inflation regime—the “Goldilocks” scenario where markets have historically performed their best. This backdrop helps explain why stocks fared so well last year.
But here’s the catch: the margin between growth and potential GDP is razor thin. It wouldn’t take much for us to slip into a Slow Growth/Low Inflation regime this year. While that’s not a bad place to be (historically, it’s produced solid 8.7% annualized returns), it’s not quite the sweet spot we’ve been enjoying.
The bottom line? Markets and the economy move through regimes, and understanding these cycles helps investors objectively assess when the environment is most favorable for stocks. Whether we remain in Goldilocks territory or shift into a more moderate regime, keeping an eye on growth and inflation trends is key to navigating what comes next.
This is intended for informational purposes only and should not be used as the primary basis for an investment decision. Consult an advisor for your personal situation.
Indices mentioned are unmanaged, do not incur fees, and cannot be invested into directly.
Past performance does not guarantee future results.
The S&P 500 Index, or Standard & Poor’s 500 Index, is a market-capitalization-weighted index of 500 leading publicly traded companies in the U.S.
