Often, when you hear people talking about the stock market being over or undervalued, they’re usually thinking about it in absolute terms. By that, I mean that they’ll look at a company and see that it’s earning, let’s say, $5 per share and that its stock is currently trading for $100 share, so its price-to-earnings ratio is 20. In other words, for every dollar in earnings the company generates, investors are willing to pay $20 to own its stock. Based on that information and that information alone, the investor then determines if that is a good deal or not.
But that process leaves out other important information about how a stock’s price gets valued—like interest rates. When interest rates are high, stocks face more competition from interest-bearing assets like bonds, so investors are less willing to pay such high multiples for stock earnings. And conversely, when interest rates are low, stocks face less competition from bonds—because their yields are low—so they bid up the price of stocks in response.
In order to quantify this relationship, we must measure two things: the current bond yield and the current stock earnings yield.
The bond yield is easy. That’s just the current yield on a government-issued bond. In this case, we use the yield on the benchmark 10-year U.S. Treasury bond, which was hovering around 1.8% as of last week.
The stock earnings yield takes a little more thinking, but it’s fairly straightforward as well. It’s just the inverse of the S&P 500’s price-to-earnings ratio (or P/E ratio). So, like in our example above, instead of dividing the stock’s current price per share of $100 by the earnings per share of $5, we flip it around and divide the earnings per share by the price per share. This would give us an earnings yield of 5/100 = 5% in that example. In other words, a $100 stock earning $5 per share has an earnings yield of 5%.
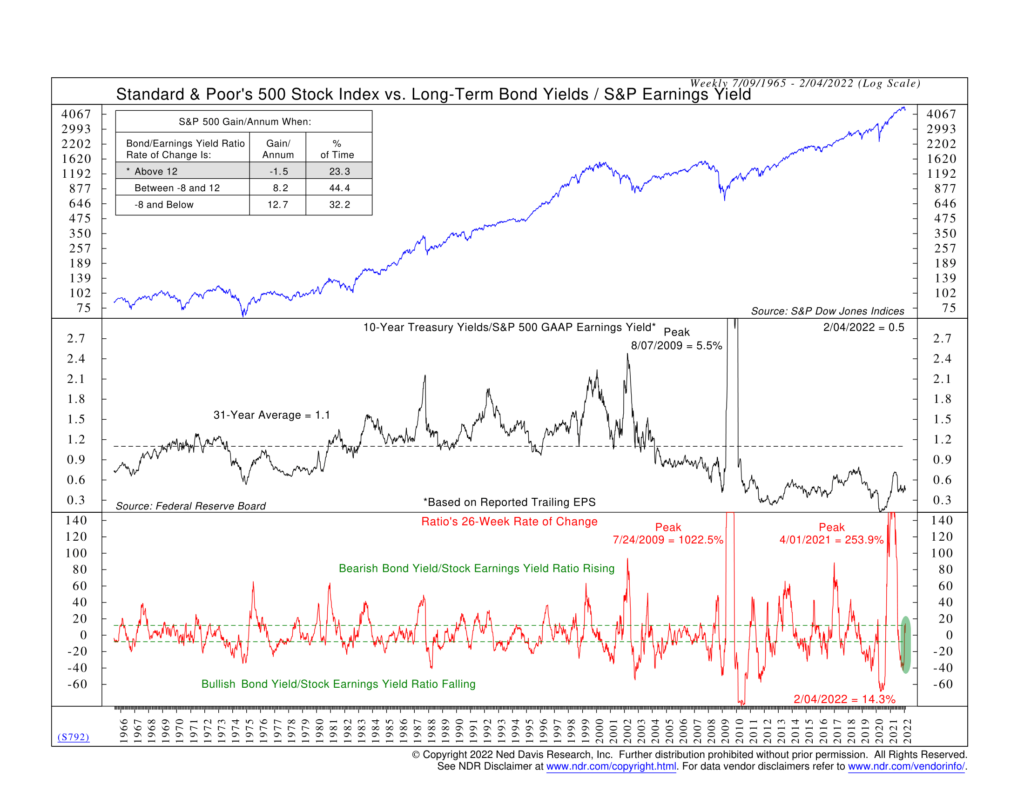
The current earnings yield for the S&P 500 stock index as a whole is roughly 3.8%. So, what our indicator above does is it takes the earnings yield of 3.8% and divides it by the 10-year Treasury bond yield of 1.8%. This produces a ratio, which is the black line in the middle clip of the chart. We then take the 26-week rate-of-change of that ratio to measure the momentum of this relationship, shown as the red line on the bottom of the chart.
Historically, when the momentum of the bond yield/stock earnings yield ratio rises rapidly, it’s been a bearish condition for the stock market. But when the ratio is falling quickly, it produces more favorable conditions for stock returns. You can see this in the return box in the chart’s upper left corner.
Looking at the chart, we can see that up until recently, stocks appeared undervalued relative to bonds based on their respective yields. You would not have gotten this same message if you had looked at traditional valuation metrics that ignore interest rates. They’ve been saying stocks are overvalued for many years now. You would have missed out on the major bull run that stocks experienced coming out of the pandemic lows, not to mention the past decade or so. That’s the reason why we incorporate relative valuation indicators into our analysis.
Looking at the current reading of the indicator, we see that bond yields have started moving higher at a faster pace in recent weeks, which has caused the bond yield/stock earnings yield ratio to move up quickly. It’s now above the upper band that signifies a bearish environment for stocks. This explains so much of the volatility we’ve seen in the stock market recently.
These are just a few examples of the value that relative valuation metrics can add to an analysis. Taking current conditions into account when valuing the stock market adds more depth to the analysis and makes it more practical. Relatively speaking, that’s a good thing.
This is intended for informational purposes only and should not be used as the primary basis for an investment decision. Consult an advisor for your personal situation.
Indices mentioned are unmanaged, do not incur fees, and cannot be invested into directly.
Past performance does not guarantee future results.