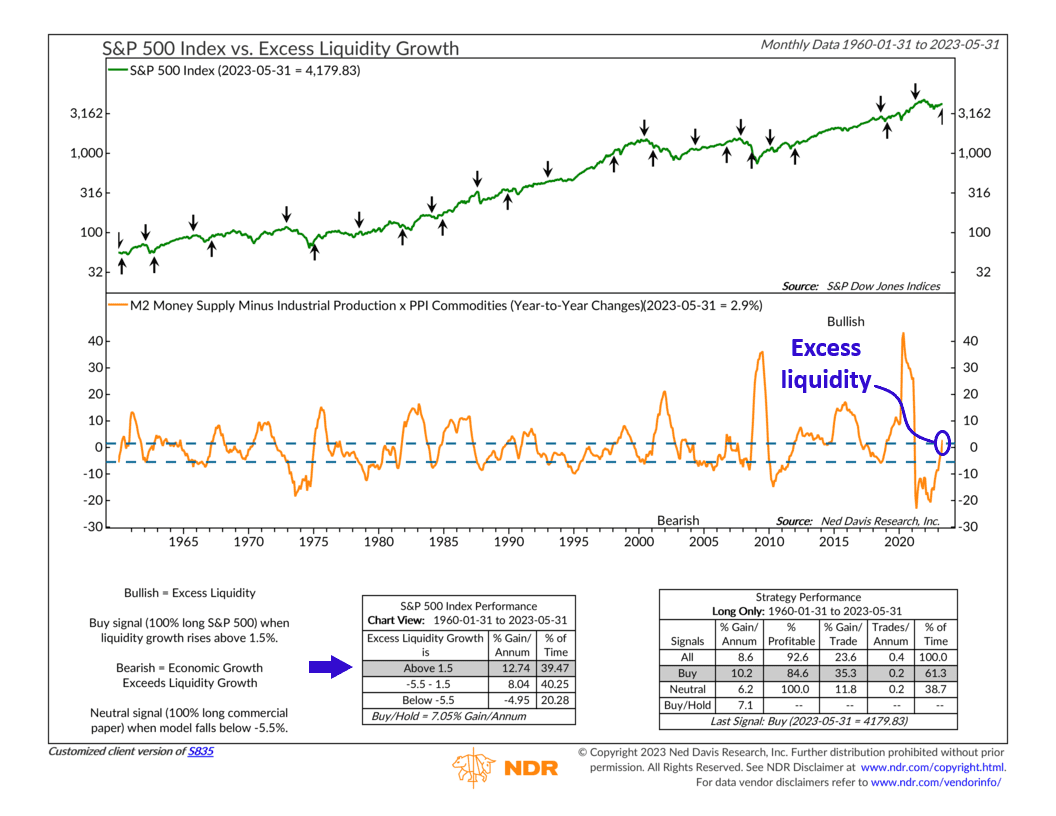
Liquidity, or easily accessible money, is an important driver of stock market returns. A simple metric commonly used to measure liquidity is the M2 money supply, a broad measure of the money in the economy available for spending and investment. When it’s rising, it tends to be bullish for stock returns, and vice versa.
But we can do even better than that. This week’s indicator looks at the 12-month change in the M2 money supply—but then subtracts from it the annual growth rate of industrial production and the commodity price component of the Producer Price Index (PPI), shown as the orange line on the bottom of the chart.
Why do this? Because the industrial production and PPI commodities combo represent the economy (excluding inflation), which requires liquidity to grow. So, when the growth rate of the M2 money supply exceeds that of industrial production and PPI commodities, it’s a sign that there’s more than enough liquidity in the economy. That excess liquidity often finds it way into the stock market. Indeed, as the performance box shows, periods of excess liquidity correspond well with stock market uptrends.
But of course, the opposite is true as well. When growth in the economy exceeds growth in the money supply, the indicator falls, a sign that the rapidly growing economy is sucking liquidity away from the stock market. This tends to hurt stock prices.
This is precisely what happened last year. With inflation running hot, the Federal Reserve hiked rates and drained money from the economy. The annual growth rate in the M2 money supply plummeted, but the economy (industrial production and PPI Commodities) held up relatively well. Our indicator dropped to deeply negative levels, indicating insufficient liquidity—and the stock market fell too.
However, there is good news to report. We have seen a complete reversal in the indicator’s trajectory since the lows of last year. Last month, it turned positive and ascended into the upper bullish zone on the chart. Although the annual growth rate of the M2 money supply remains negative, the growth rate of industrial production has slowed down to nearly zero, and commodity inflation has also cooled off.
What does this mean? While liquidity within the system remains relatively tight from an absolute perspective, in relation to the economy, it has become significantly more accommodating. This shift bodes well for stocks and is likely a positive development.
This is intended for informational purposes only and should not be used as the primary basis for an investment decision. Consult an advisor for your personal situation.
Indices mentioned are unmanaged, do not incur fees, and cannot be invested into directly.
Past performance does not guarantee future results.
