“Sell in May, go away, and don’t come back till St. Leger’s Day.” That old English rhyme refers to a custom that originated in Britain where the bankers would flee the city of London during the hot summer months to relax in the countryside. They would then return on St. Leger’s day—a reference to the St. Leger’s Stakes, a famous horserace held in Mid-September.
This old story eventually evolved into the market adage we still hear today: sell in May and go away. The theory is that traders and investors—much like the old London bankers—spend more time on vacation during the “summery” five-month period between May and September. As a result, stock performance is lower during this period due to lackluster trading volumes and a lack of market participants.
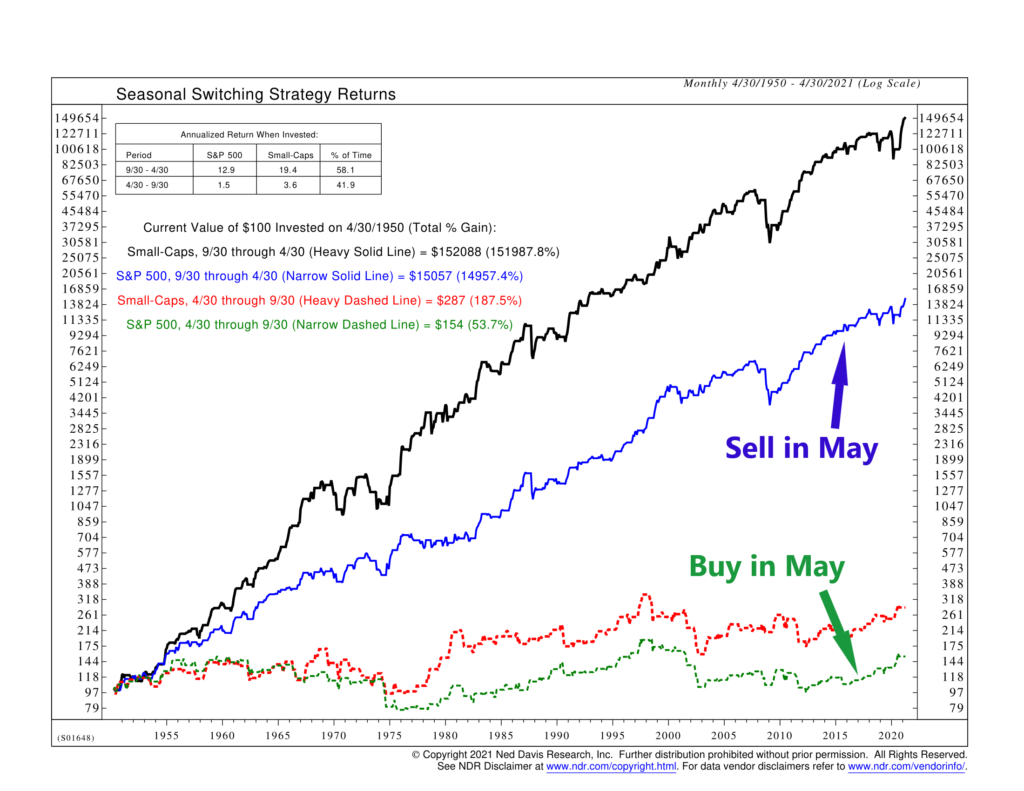
This may all seem a little odd. And yet, the historical record supports the theory. As our featured indicator above shows, going all the way back to 1950, the stock market has indeed underperformed during the “summery” months (May through September) relative to the “wintery” months (October through April).
Here’s how it works. The blue line represents what would have happened if you had put $100 into the S&P 500 stock index starting in 1950 but only kept it invested during the October to April months. In other words, you sold in May, stayed in cash for five months, and then reinvested. By contrast, the green dashed line shows the same thing, but if you had done the opposite: stayed invested from May through September, and then sold and went to cash from October to April.
The difference in returns is quite striking. The “Sell in May” strategy (blue line) would have grown to a value of $15,057 over these 70 years—a cumulative return of nearly 15,000%! However, the “Buy in May” strategy (green dashed line) would have only grown to $154—a measly 54% return over the entire period. To put it differently, on an annualized basis, the “Sell in May” strategy returns about 12.9% per year, whereas the “Buy in May Strategy” gains just 1.5% per year. (Note: The chart also shows this same strategy but applied to small-cap stocks; interestingly, the strategy works the same, but the return differential is even larger).
To be sure, the strategy hasn’t worked as well in recent years. However, the long-run historical record is still pretty astonishing and shows that the market isn’t always a perfectly efficient machine.
This is intended for informational purposes only and should not be used as the primary basis for an investment decision. Consult an advisor for your personal situation.
Indices mentioned are unmanaged, do not incur fees, and cannot be invested into directly.
Past performance does not guarantee future results.