Ever get the feeling the stock market is getting a little…too excited? Or alternatively, too calm?
Well, enter this week’s featured indicator, the ETF Speculation Index. This tool measures just how hyped up—or downright gloomy—investors are feeling in the market.
To understand this indicator, we must introduce two key concepts: leveraged long ETFs and inverse ETFs. But first, let’s define an ETF. An ETF, or Exchange-Traded Fund, is like a basket of different stocks or assets you can buy and sell on the stock market, similar to a single stock.
Now, a leveraged long ETF is like a regular ETF but with a twist—it uses borrowed money to amplify gains, aiming to give you 2x or even 3x the daily return of its chosen stocks or assets. As for an inverse ETF, it’s designed to go up when the market or a specific index goes down, allowing you to profit from declines in value.
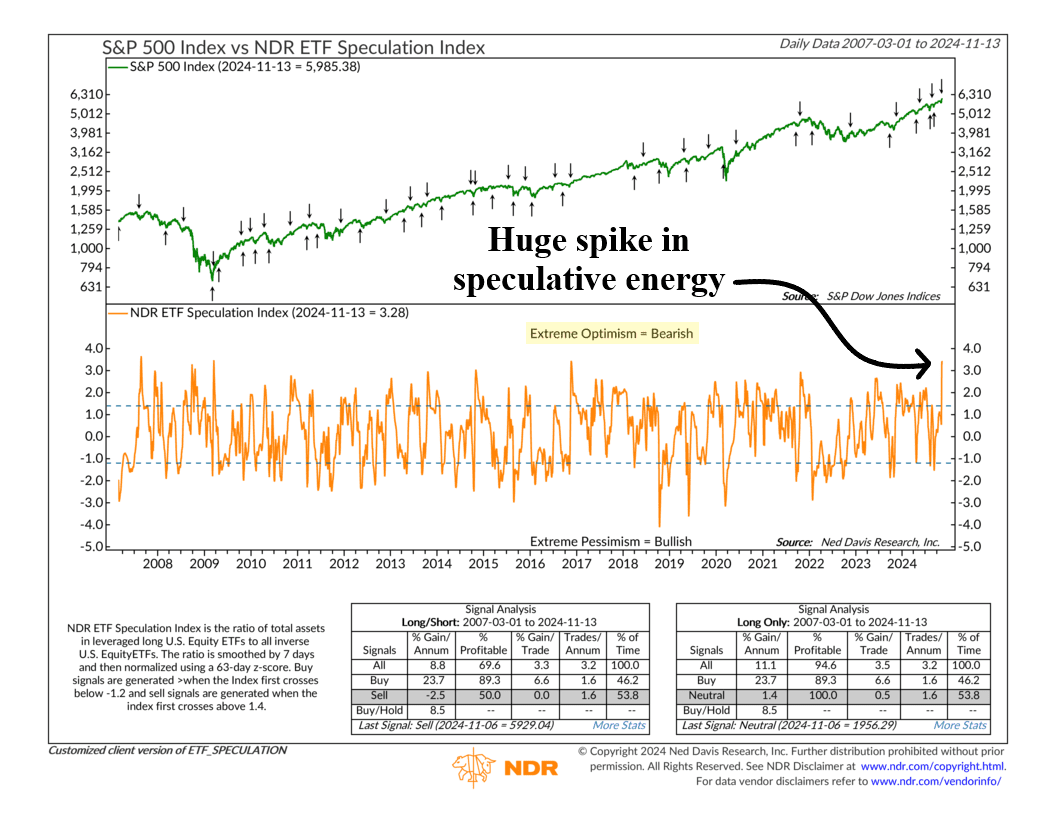
So, when investors are excited about the stock market, they tend to buy leveraged long ETFs. And when they’re pessimistic, they tend to buy inverse ETFs. The ETF Speculation Index, shown as the orange line on the chart, simply takes the ratio between these two measures and normalizes them using a 63-day z-score to see when one or the other reaches an extreme.
For example, the index is lightening up with extreme optimism right now. Investors have been piling into leveraged ETF positions, driving the ETF Speculation Index ratio to a lofty reading of 3.28. That’s well above its threshold of 1.4, indicating extreme optimism.
That’s good, right? Well, actually, no. Historically, as the performance box shows, when everyone’s this optimistic, the market often takes a breather, leading to sub-par returns for the S&P 500 Index.
Of course, the concept also works in reverse. When the ratio dips below the reading of -1.2, the indicator triggers a buy signal since this means everyone is piling into inverse ETFs. Again, the crowd tends to be wrong at the extremes, so that sort of extreme pessimism has actually been bullish for the stock market in the past.
This is just another example of a contrarian indicator, or what we call Investor Behavior. It tends to push back against the other types of indicators we use to measure things like price trends and momentum.
Basically, it’s a great way to keep your outlook balanced, helping you avoid getting swept up in extreme price action.
This is intended for informational purposes only and should not be used as the primary basis for an investment decision. Consult an advisor for your personal situation.
Indices mentioned are unmanaged, do not incur fees, and cannot be invested into directly.
Past performance does not guarantee future results.
The S&P 500 Index, or Standard & Poor’s 500 Index, is a market-capitalization-weighted index of 500 leading publicly traded companies in the U.S.
